Results of Comprehensive Modular Survey: Education, 2025 (April – June, 2025)
Results of Comprehensive Modular Survey: Education, 2025 (April – June, 2025)
The CMS Education survey, part of the 80th round of the National Sample Survey (NSS), focused specifically on household expenditure for currently enrolled students in school education. Data was collected from 52,085 households and 57,742 students across India using Computer-Assisted Personal Interviews (CAPI). The survey’s design and methodology are detailed in the full report.
Key highlights:
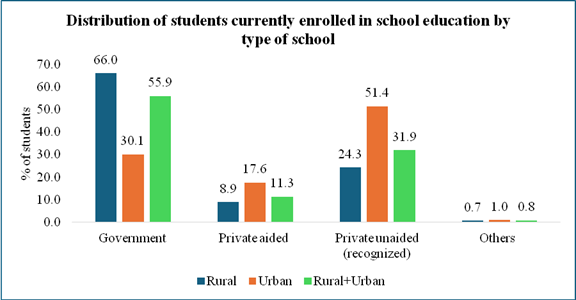
Government schools play a pivotal role in providing education across India, accounting for 55.9% of total enrolments. It is higher in rural areas, where two-thirds (66.0%) of students are enrolled, in comparison to urban areas (30.1%). The Private unaided (recognized) schools account for 31.9% of enrolment nationwide.
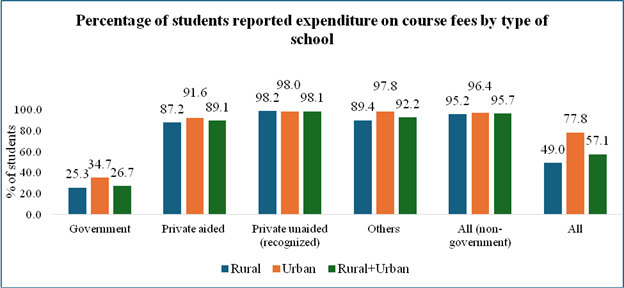
Only 26.7% of students enrolled in government schools reported paying course fees, in contrast to 95.7% of students in non-government schools. Among different types of non-government schools, 98.0% students reported paying course fees in private unaided schools in urban areas. In rural areas, 25.3% of students reported paying course fees in Government schools.
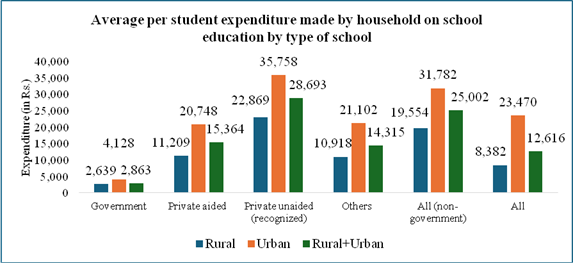
The average per student expenditure made by households on school education during the current academic year in government schools was estimated at ₹2,863, while it was significantly higher (₹25,002) in non-government schools.
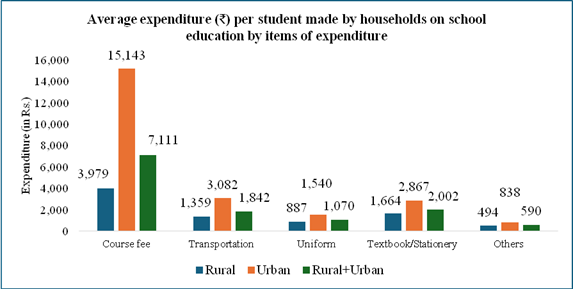
Across all types of schools, the highest average expenditure per student during the current academic year was on course fees (₹7,111), followed by textbooks and stationery (₹2,002) at the all-India level. The urban households paying significantly more across all categories. Notably, the average expenditure on course fees in urban areas was estimated at ₹15,143, whereas it was estimates at ₹3,979 in rural areas. This trend of higher expenditure in urban areas also evident for other types of education related expenses like transportation, uniforms, and textbooks.
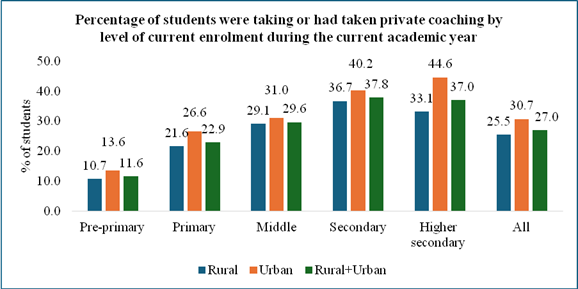
Nearly a third of all students (27.0%), were taking or had taken private coaching during the current academic year. This trend was more common in urban areas (30.7%) than in rural areas (25.5%).
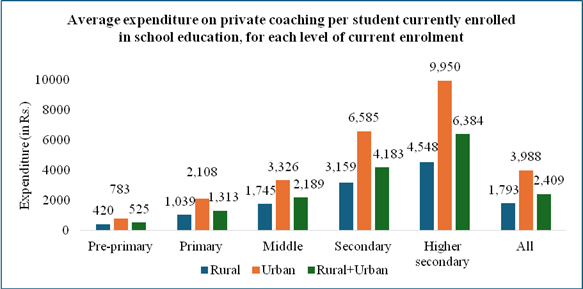
Average annual household expenditure on private coaching per student in urban areas (₹3,988) was higher than that in rural areas (₹1,793). This difference increases with level of education. In urban areas, average spending on private coaching at the higher secondary level (₹9,950) is significantly higher than in rural areas (₹4,548). Nationally, coaching costs rises with each education level, from ₹525 for pre-primary to ₹6,384 for higher secondary.
Among the students who made expenditure for school education, 95% students in India reported that the first major source of their funding was from other household members. This trend is consistent across both rural (95.3%) and urban (94.4%) areas. In India, 1.2 % students reported that Government scholarships was their first major source of funding for school education.
Source of funding (first major source)
Rural
Urban
Rural+Urban
Funded by other members of the household
95.3
94.4
95.0
Funded by erstwhile household member
2.5
2.2
2.4
Scholarships from Government
1.4
0.9
1.2
Others
0.8
2.5
1.4
Important Caveat:
The most recent comprehensive education survey undertaken by NSS was the 75th Round (July 2017–June 2018). However, its findings cannot be directly compared with those of CMS: E. In the NSS 75th Round, anganwadi centres were not classified under pre-primary education, and expenditures on school education included private coaching. However, CMS: E classified anganwadis within the pre-primary category and collected and presented spending on school education and private coaching separately.
The primary objective of the CMS: E was to generate national-level estimates of average expenditure on school education and private coaching during the current academic year. The state-level estimates based on the available sample observations have also been generated and presented in this report. Therefore, users should interpret the survey results at the sub-national level with careful consideration of the associated sample size in the domain and Relative Standard Error (RSE).
It is also important to note that the survey-based estimated totals were used exclusively for calculating rates and ratios. These totals are not intended to serve as definitive population-level counts. Therefore, using these totals to directly interpret the estimates in absolute terms or for extrapolation may lead to misleading conclusions and is not recommended. Users of the data are requested to interpret the findings with due consideration of these statistical limitations.
The report of the Comprehensive Modular Survey: Education is available on the Ministry’s website (http://www.mospi.gov.in).