“The Indian Telecom Services Yearly Performance Indicators” for the year 2024-25
“The Indian Telecom Services Yearly Performance Indicators” for the year 2024-25
TRAI today has released the “The Indian Telecom Services-Yearly Performance Indicators” for the year 2024-25. This Report provides a broad perspective of the Telecom Services in India and presents the key parameters and growth trends of the Telecom Services as well as Cable TV, DTH & Radio Broadcasting services in India for the period covering 1st April, 2024 to 31st March, 2025. This report is compiled mainly on the basis of the information furnished by the Service Providers.
Executive Summary of the Report is enclosed. The complete Report is available on TRAI’s website www.trai.gov.in and under the link http://www. trai.gov.in/release-publication/reports/performance-indicators-reports. Any suggestion or any clarification pertaining to this report, Shri Vijay Kumar, Advisor (F&EA), TRAI may be contacted on Tel. +91-20907773 and e-mail: advfea1@trai.gov.in.
Executive Summary
Total number of internet subscribers increased from 954.40 million at the end of Mar-24 to 969.10 million at the end of Mar-25 with yearly rate of growth of 1.54%. Out of total 969.10 million internet subscribers, number of broadband subscribers is 944.12 million and number of narrowband subscribers is 24.98 million at the end of Mar-25.
Composition of Internet subscription as on 31st March, 2025
Number of Broadband subscribers increased from 924.07 million at the end of Mar-24 to 944.12 million at the end of Mar-25 with yearly rate of growth of 2.17%. The number of Narrowband subscribers decreased from 30.34 million at the end of Mar-24 to 24.98 million at the end of Mar-25 with yearly rate of decline of 17.66%.
Average Revenue Per User (ARPU) per month for wireless service increased from Rs.149.25 in 2023-24 to Rs.174.46 in 2024-25, thereby showing a yearly rate of growth of 16.89%.
Average Revenue Per User (ARPU) per month for prepaid service increased from Rs.146.37 in 2023-24 to Rs.173.84 in 2024-25. However, ARPU per month for postpaid service decreased from Rs.184.63 to Rs.180.86 during the same period.
Average Minutes of Usage (MOUs) per subscriber per month increased from 963 in 2023-24 to 1000 in 2024-25 with yearly rate of growth of 3.91%.
Minutes of Usage (MOUs) per subscriber per month for postpaid services decreased from 544 during the year 2023-24 to 503 in 2024-25. However, MoUs for prepaid services increased from 997 to 1047 during the same period.
Number of wireless data subscribers has increased from 913.34 million at the end of Mar-24 to 939.51 million at the end of Mar-25 with yearly rate of growth of 2.87%. Further, total volume of wireless data usage increased from 1,94,774 PB during the year 2023-24 to 2,28,779 PB during the year 2024-25 with yearly growth of 17.46%.
Total revenue from wireless data usage increased from Rs. 1,86,226 crore in the year 2023-24 to Rs.2,15,078 crore in the year 2024-25 with yearly rate of growth of 15.49%.
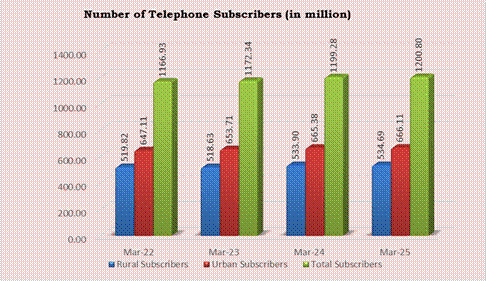
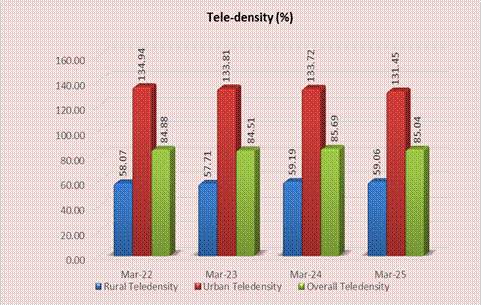
The total number of telephone subscribers in India increased from 1,199.28 million at the end of Mar-24 to 1,200.80 million at the end of Mar-25, registering a yearly rate of growth 0.13%. The overall Tele-density in India decreased from 85.69% at the end of Mar-24 to 85.04% at the end of Mar-25 at yearly rate of decline 0.75%.
Telephone subscription in Urban Areas increased from 665.38 million at the end of Mar-24 to 666.11 million at the end of Mar-25 at the yearly rate of growth 0.11%. However, Urban Tele-density declined from 133.72% at the end of Mar-24 to 131.45% at the end of Mar-25 with yearly rate of decline of 1.70%.
Rural telephone subscription increased from 533.90 million at the end of Mar-24 to 534.69 million at the end of Mar-25 at the yearly rate of growth of 0.15%. However, Rural Tele-density decreased from 59.19% to 59.06% during the same period of time.
Trend of Tele-density
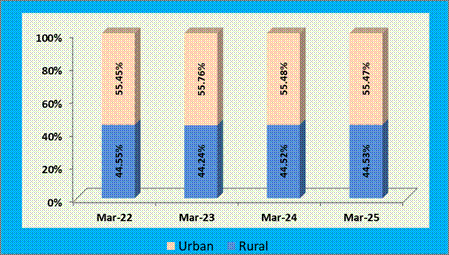
Out of the total telephone subscription, the shares of Rural telephone subscription increased from 44.52% at the end of Mar-24 to 44.53% at the end of Mar-25. The following chart depicts the rural-urban market share of telephone subscribers of the four years.
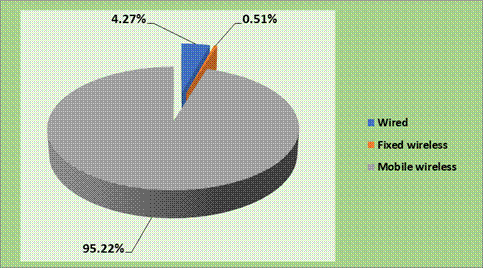
Out of 1,200.80 million of total telephone subscriber, the number of Wireless (Mobile+5G FWA) Telephone subscribers is 1,163.76 million and the number of Wireline Telephone subscribers is 37.04 million at the end of Mar-25. The following chart depicts the market share of Wireless and Wireline subscribers in India.
Composition of Market Share
Wireless & Wireline Subscribers
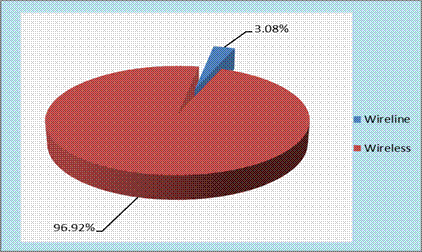
Total Wireless subscribers decreased from 1,165.49 million (Mobile) at the end of Mar-24 to 1,163.76 million (Mobile+5G FWA) at the end of Mar-25, thereby showing a yearly rate of decline of 0.15%. During the year 2024-25, net loss of 1.74 million wireless subscribers was recorded.
Overall Wireless Teledensity decreased from 83.27% (Mobile) at the end of Mar-24 to 82.42% (Mobile+5G FWA) at the end of Mar-25. Rural wireless Teledensity decreased from 58.87% to 58.67% and Urban wireless Teledensity also decreased from 127.51% to 124.83% at the end of Mar-25.
Wireless (Mobile) subscribers decreased from 1,165.49 million at the end of Mar-24 to 1,156.99 million at the end of Mar-25, thereby showing a yearly rate of decline of 0.73%. During the year 2024-25, net loss of 8.50 million wireless subscribers was recorded.
Wireless (Mobile) Teledensity decreased from 83.27% at the end of Mar-24 to 81.94% at the end of Mar-25. Rural wireless Teledensity decreased from 58.87% to 58.40% and Urban wireless Teledensity also decreased from 127.51% to 123.99% at the end of Mar-25.
Total Wireline subscriber base increased from 33.79 million at the end of Mar-24 to 37.04 million at the end of Mar-25 with yearly rate of growth of 9.62%.
Overall Wireline Tele-density increased from 2.41% at the end of Mar-24 to 2.62% at the end of Mar-25. During the same period Rural wireline tele-density increased from 0.32% to 0.39% and Urban wireline tele-density also increased from 6.21% to 6.62%.
Gross Revenue (GR) increased from Rs.3,36,066 crore in the year 2023-24 to Rs.3,72,097 crore in the year 2024-25 with yearly rate of growth of 10.72% and Applicable Gross Revenue (ApGR) increased from Rs.3,23,142 crore to Rs.3,56,283 crore with yearly growth rate of 10.26% during same period. Adjusted Gross Revenue (AGR) also increased from Rs. 2,70,504 crore in the year 2023-24 to Rs. 3,03,025 crore in the year 2024-25 with yearly rate of growth of 12.02%.
Pass through charges decreased by 1.31% from Rs.53,579 crore in the year 2023-24 to Rs.52,879 crore in the year 2024-25. Pass-through charges as a percentage of Gross Revenue are 14.21% in 2024-25 as against 15.94% in the previous financial year.
Spectrum Usage Charges (SUC) yearly increased by 13.02% from Rs.3,369 crore in the year 2023-24 to Rs.3,807 crore in the year 2024-25 and License Fee also increased by 12.02% from Rs.21,642 crore to Rs.24,242 crore during the same period.
Service wise composition of Adjusted Gross Revenue for the year 2024-25
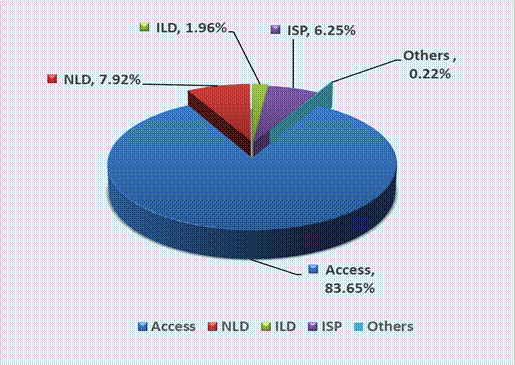
Access services contributed 83.65% of the total Adjusted Gross Revenue of telecom services. In Access services, Gross Revenue (GR), Applicable Gross Revenue (ApGR), Adjusted Gross Revenue (AGR), License Fee (LF) and Spectrum Usage Charges (SUC) increased by 13.77%, 12.88%, 15.52%. 15.57 and 13.11% respectively in the year 2024-25 over the year 2023-24. However, Pass Through Charges decreased by 1.98% during the same period.
A total of approximately 918 private satellite TV channels have been permitted by the Ministry of Information and Broadcasting (MIB), as on 31.03.2025, for uplinking only/downlinking only/both uplinking & downlinking. Out of 918 permitted satellite TV channels, 908 channels are available for downlinking in India.
As per the reporting done by broadcasters in pursuance of the Tariff Order dated 3rd March 2017 as amended, out of 908 permitted satellite TV channels which are available for downlinking in India, there are 333 satellite pay TV channels as on 31st March 2025. Out of 333 pay channels, 232 are SD satellite pay TV channels and 101 are HD satellite pay TV channels.
During the period ending 31st March, 2025, there were 4 pay DTH service providers in India. Pay DTH has net pay active subscriber base of around 56.92 million, as on 31st March, 2025 as compared to 61.97 million subscribers, as on 31st March, 2024. This is in addition to the subscribers of the free DTH services of Doordarshan.
Apart from the radio Stations operated by All India Radio, the public broadcaster, as on 31st March 2024, there were 388 operational private FM Radio stations in 113 cities with operational 36 Private FM Radio broadcaster. During the quarter ending 31st March 2025, six channels operated by three private FM radio operators, namely, (i) Digital Radio (Delhi) Broadcasting Ltd (3 channels), (ii) Digital Radio (Mumbai) Broadcasting Ltd (2 channels), and (iii) Digital Radio (Kolkata) Broadcasting Ltd (1 channel), were merged with South Asia FM Ltd. Now, as of 31st March 2025, there are 388 operational private FM radio channels across 113 cities, operated by 33 private FM radio operators.
As on 31st March 2025, 531 Community Radio stations are operational as compared to 494 Community Radio station, as on 31st March, 2024.
Snapshot
(Data as on 31st March, 2025)
Telecom Subscribers (Wireless+Wireline)
Total Subscribers
1,200.80 Million
% change over the previous year
0.13%
Urban Subscribers
666.11 Million
Rural Subscribers
534.69 Million
Market share of Private Operators
91.47%
Market share of PSU Operators
8.53%
Tele-density
85.04%
Urban Tele-density
131.45%
Rural Tele-density
59.06%
Wireless Subscribers
Wireless (Mobile) Subscribers
1,156.99 Million
Wireless (5G FWA) Subscribers
6.77 Million
Total Wireless (Mobile+5G FWA) Subscribers
1,163.76 Million
% change over the previous year
-0.15%
Urban Subscribers
632.57 Million
Rural Subscribers
531.18 Million
Market share of Private Sector Operators
92.09%
Market share of Public Sector Operators
7.91%
Tele-density
82.42%
Urban Tele-density
124.83%
Rural Tele-density
58.67%
No. of total Public Mobile Radio Trunk Services (PMRTS)
67,023
No. of Very Small Aperture Terminals (VSAT)
2,43,663
Wireline Subscribers
Total Wireline Subscribers
37.04 Million
% change over the previous year
9.62%
Urban Subscribers
33.54 Million
Rural Subscribers
3.50 Million
Market share of Private Operators
72.13%
Market share of PSU Operators
27.87%
Tele-density
2.62%
Rural Tele-density
0.39%
Urban Tele-density
6.62%
No. of Public Call Office (PCO)
10,185
Internet/Broadband Subscribers
Total Internet Subscribers
969.10 Million
% change over previous year
1.54%
Broadband subscribers
944.12 Million
Narrowband subscribers
24.98 Million
Wired Internet Subscribers
41.41 Million
Wireless Internet Subscribers
927.70 Million
Urban Internet Subscribers
561.42 Million
Rural Internet Subscribers
407.69 Million
M
Total Internet Subscribers per 100 population
68.63
Urban Internet Subscribers per 100 population
110.79
Rural Internet Subscribers per 100 population
45.03
Telecom Financial Data for the Financial Year-2024-25
Gross Revenue (GR)
Rs.3,72,097 Crore
% change in GR over the previous year
10.72%
Applicable Gross Revenue (ApGR)
Rs.3,56,283 Crore
% change in ApGR over the previous year
10.26%
Adjusted Gross Revenue (AGR)
Rs. 3,03,025 Crore
% change in AGR over the previous year
12.02%
Share of Public Sector Operators in Access AGR
3.56%
Broadcasting & Cable Services
Number of private satellite TV channels permitted by the Ministry of I&B for uplinking only/downlinking only/both uplinking and downlinking
918
Number of Pay TV Channels
333
Number of private FM Radio Stations (excluding All India Radio)
388
Number of Pay Subscribers Active with Private DTH Operators
56.92 Million
Number of Operational Community Radio Stations
531
Number of pay DTH Operators
4
Revenue & Usage Parameters (for the Year 2024-25)
Monthly ARPU for Wireless Service
Rs.174.46
% change in ARPU over previous year
16.89%
Minutes of Usage (MOU) per subscriber per month – Wireless
1000 Minutes
Average Revenue for wireless data per data subscriber per month for wireless services
Rs.231.46
Average revenue realization per GB for wireless data usage
Rs.8.97
Average Wireless Data Usage per wireless data subscriber per month
21.53 GB