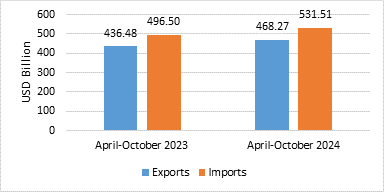
The cumulative overall exports during April-October 2024 is estimated at USD 468.27Billion, as compared to USD 436.48Billion in April-October 2023, with an estimated growth of 7.28%
The cumulative overall exports during April-October 2024 is estimated at USD 468.27Billion, as compared to USD 436.48Billion in April-October 2023, with an estimated growth of 7.28%
October 2024
April-October 2024
India’s total exports (Merchandise and Services combined) for October 2024* is estimated at USD 73.21 Billion, registering a positive growth of 19.08 percent vis-à-vis October 2023.Total imports (Merchandise and Services combined) for October 2024* is estimated at USD 83.33 Billion, registering a positive growth of 7.77 percent vis-à-vis October 2023.
Table 1: Trade during October 2024*
October 2024
(USD Billion)
October 2023
(USD Billion)
Merchandise
Exports
39.20
33.43
Imports
66.34
63.86
Services*
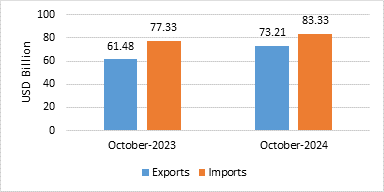
Exports
34.02
28.05
Imports
17.00
13.46
Total Trade
(Merchandise +Services) *
Exports
73.21
61.48
Imports
83.33
77.33
Trade Balance
-10.12
-15.85
* Note: The latest data for services sector released by RBI is for September2024. The data for October 2024 is an estimation, which will be revised based on RBI’s subsequent release. (ii) Data for April-October 2023 and April-June 2024 has been revised on pro-rata basis using quarterly balance of payments data.
Fig 1: Total Trade during October2024*
India’s total exports during April-October2024* is estimated at USD 468.27 Billion registering a positive growth of 7.28 percent. Total imports during April-October 2024* is estimated at USD 531.51 Billion registering a growth of 7.05 percent.
Table 2: Trade during April-October 2024*
April-October 2024
(USD Billion)
April-October 2023
(USD Billion)
Merchandise
Exports
252.28
244.51
Imports
416.93
394.18
Services*
Exports
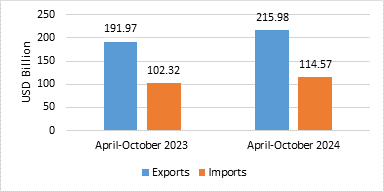
215.98
191.97
Imports
114.57
102.32
Total Trade
(Merchandise +Services) *
Exports
468.27
436.48
Imports
531.51
496.50
Trade Balance
-63.24
-60.02
Fig 2: Total Trade during April-October 2024*
MERCHANDISE TRADE
Fig 3: Merchandise Trade during October 2024
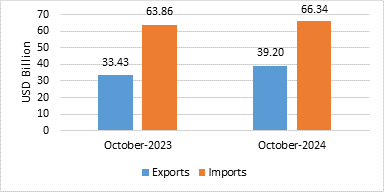
Fig4: Merchandise Trade during April-October 2024
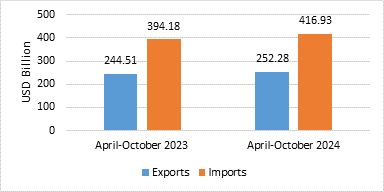
Table 3: Trade excluding Petroleum and Gems & Jewellery during October 2024
(USD Billion)
October 2023
(USD Billion)
Non- petroleum exports
34.61
27.55
Non- petroleum imports
48.04
47.72
Non-petroleum & Non-Gems & Jewellery exports
31.36
24.56
Non-petroleum & Non-Gems & Jewellery imports
39.21
37.23
Note: Gems & Jewellery Imports include Gold, Silver & Pearls, precious & Semi-precious stones
Fig 5: Trade excluding Petroleum and Gems & Jewellery during October 2024
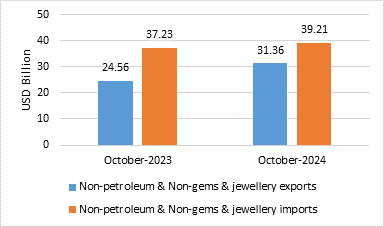
Table 4: Trade excluding Petroleum and Gems & Jewellery during April-October 2024
(USD Billion)
April-October 2023
(USD Billion)
Non- petroleum exports
211.34
196.88
Non- petroleum imports
309.78
294.08
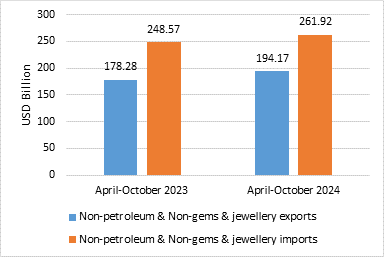
Non-petroleum &Non Gems& Jewellery exports
194.17
178.28
Non-petroleum & Non Gems & Jewellery imports
261.92
248.57
Note: Gems & Jewellery Imports include Gold, Silver & Pearls, precious & Semi-precious stones
Fig 6: Trade excluding Petroleum and Gems &Jewellery during April-October 2024
SERVICES TRADE
Fig 7: Services Trade during October2024*
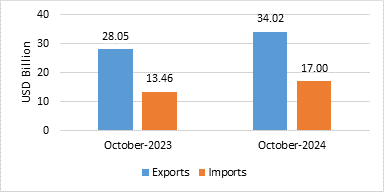
Fig 8: Services Trade during April-October 2024*