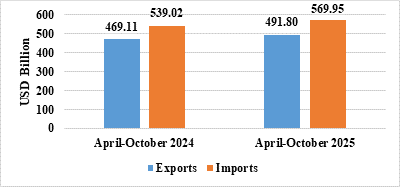
The cumulative exports (merchandise & services) during April-October 2025 is estimated at US$ 491.80 Billion, as compared to US$ 469.11 Billion in April-October 2024, estimated growth of 4.84%.
The cumulative exports (merchandise & services) during April-October 2025 is estimated at US$ 491.80 Billion, as compared to US$ 469.11 Billion in April-October 2024, estimated growth of 4.84%.
October 2025
April-October 2025
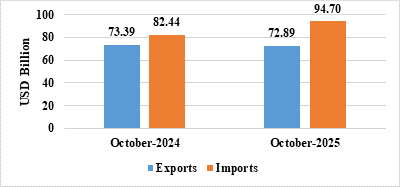
India’s total exports (Merchandise and Services combined) for October 2025* is estimated at US$ 72.89 Billion, registering a negative growth of (-) 0.68 percent vis-à-vis October 2024. Total imports (Merchandise and Services combined) for October 2025* is estimated at US$ 94.70 Billion, registering a positive growth of 14.87 percent vis-à-vis October 2024.
Table 1: Trade during October 2025*
October 2025
(US$ Billion)
October 2024
(US$ Billion)
Merchandise
Exports
34.38
38.98
Imports
76.06
65.21
Services*
Exports
38.52
34.41
Imports
18.64
17.23
Total Trade
(Merchandise +Services) *
Exports
72.89
73.39
Imports
94.70
82.44
Trade Balance
-21.80
-9.05
* Note: The latest data for services sector released by RBI is for September 2025. The data for October 2025 is an estimation. (ii) Data for April-October 2024 and April-June 2025 has been revised on pro-rata basis using quarterly balance of payments data.
Fig 1: Total Trade during October 2025*
India’s total exports during April-October 2025* is estimated at US$ 491.80 Billion registering a positive growth of 4.84 percent. Total imports during April-October 2025* is estimated at US$ 569.95 Billion registering a growth of 5.74 percent.
Table 2: Trade during April-October 2025*
April-October 2025
(US$ Billion)
April-October 2024
(US$ Billion)
Merchandise
Exports
254.25
252.66
Imports
451.08
424.06
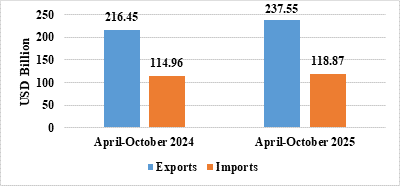
Services*
Exports
237.55
216.45
Imports
118.87
114.96
Total Trade
(Merchandise +Services) *
Exports
491.80
469.11
Imports
569.95
539.02
Trade Balance
-78.14
-69.92
Fig 2: Total Trade during April-October 2025*
MERCHANDISE TRADE
Fig 3: Merchandise Trade during October 2025
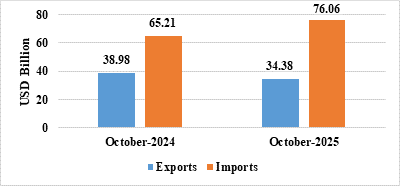
Fig 4: Merchandise Trade during April-October 2025
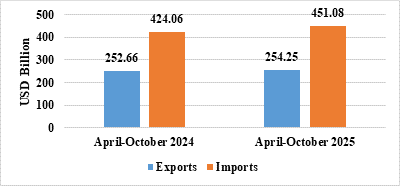
Table 3: Trade excluding Petroleum and Gems & Jewellery during October 2025
(US$ Billion)
October 2024
(US$ Billion)
Non- petroleum exports
30.43
34.57
Non- petroleum imports
61.27
46.33
Non-petroleum & Non-Gems & Jewellery exports
28.14
31.32
Non-petroleum & Non-Gems & Jewellery imports
42.78
39.58
Note: Gems & Jewellery Imports include Gold, Silver & Pearls, precious & Semi-precious stones
Fig 5: Trade excluding Petroleum and Gems & Jewellery during October 2025
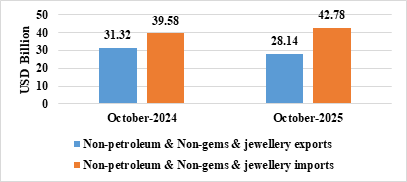
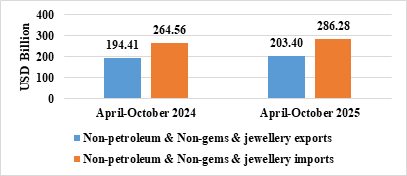
Table 4: Trade excluding Petroleum and Gems & Jewellery during April-October 2025
(US$ Billion)
April-October 2024
(US$ Billion)
Non- petroleum exports
219.90
211.60
Non- petroleum imports
344.17
312.13
Non-petroleum & Non Gems & Jewellery exports
203.40
194.41
Non-petroleum & Non Gems & Jewellery imports
286.28
264.56
Note: Gems & Jewellery Imports include Gold, Silver & Pearls, precious & Semi-precious stones
Fig 6: Trade excluding Petroleum and Gems & Jewellery during April-October 2025
SERVICES TRADE
Fig 7: Services Trade during October 2025*
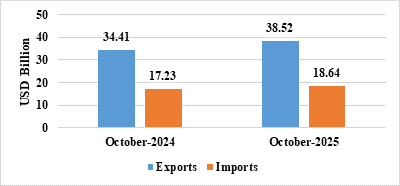
Fig 8: Services Trade during April-October 2025*
***