The cumulative exports (merchandise & services) during April-June 2025 is estimated at US$ 210.31 Billion, as compared to US$ 198.52 Billion in April-June 2024, an estimated growth of 5.94%.
The cumulative exports (merchandise & services) during April-June 2025 is estimated at US$ 210.31 Billion, as compared to US$ 198.52 Billion in April-June 2024, an estimated growth of 5.94%.
June 2025
April-June 2025
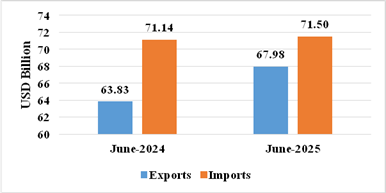
India’s total exports (Merchandise and Services combined) for June 2025* is estimated at US$ 67.98 Billion, registering a positive growth of 6.50 percent vis-à-vis June 2024. Total imports (Merchandise and Services combined) for June 2025* is estimated at US$ 71.50 Billion, registering a positive growth of 0.50 percent vis-à-vis June 2024.
Table 1: Trade during June 2025*
June 2025
(US$ Billion)
June 2024
(US$ Billion)
Merchandise
Exports
35.14
35.16
Imports
53.92
56.00
Services*
Exports
32.84
28.67
Imports
17.58
15.14
Total Trade
(Merchandise +Services) *
Exports
67.98
63.83
Imports
71.50
71.14
Trade Balance
-3.51
-7.30
* Note: The latest data for services sector released by RBI is for May 2025. The data for June 2025 is an estimation, which will be revised based on RBI’s subsequent release.
Fig 1: Total Trade during June 2025*
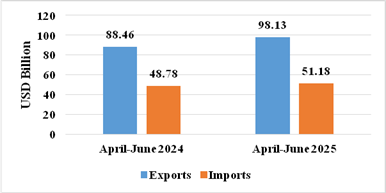
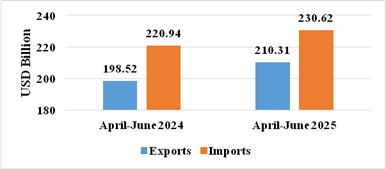
India’s total exports during April-June 2025* is estimated at US$ 210.31 Billion registering a positive growth of 5.94 percent. Total imports during April-June 2025* is estimated at US$ 230.62 Billion registering a growth of 4.38 percent.
Table 2: Trade during April-June 2025*
April-June 2025
(US$ Billion)
April-June 2024
(US$ Billion)
Merchandise
Exports
112.17
110.06
Imports
179.44
172.16
Services*
Exports
98.13
88.46
Imports
51.18
48.78
Total Trade
(Merchandise +Services) *
Exports
210.31
198.52
Imports
230.62
220.94
Trade Balance
-20.31
-22.42
Fig 2: Total Trade during April-June 2025*
MERCHANDISE TRADE
Fig 3: Merchandise Trade during June 2025
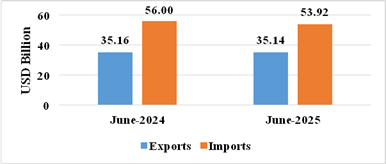
Fig 4: Merchandise Trade during April-June 2025
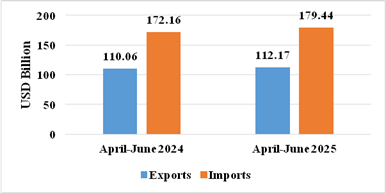
Table 3: Trade excluding Petroleum and Gems & Jewellery during June 2025
(US$ Billion)
June 2024
(US$ Billion)
Non- petroleum exports
30.53
29.67
Non- petroleum imports
40.12
40.94
Non-petroleum & Non-Gems & Jewellery exports
28.74
27.43
Non-petroleum & Non-Gems & Jewellery imports
36.57
36.55
Note: Gems & Jewellery Imports include Gold, Silver & Pearls, precious & Semi-precious stones
Fig 5: Trade excluding Petroleum and Gems & Jewellery during June 2025
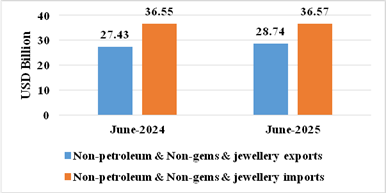
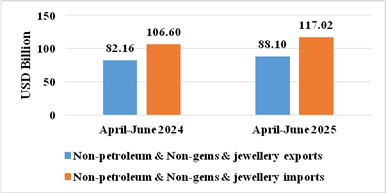
Table 4: Trade excluding Petroleum and Gems & Jewellery during April-June 2025
(US$ Billion)
April-June 2024
(US$ Billion)
Non- petroleum exports
94.77
89.42
Non- petroleum imports
130.17
120.64
Non-petroleum & Non Gems & Jewellery exports
88.10
82.16
Non-petroleum & Non Gems & Jewellery imports
117.02
106.60
Note: Gems & Jewellery Imports include Gold, Silver & Pearls, precious & Semi-precious stones
Fig 6: Trade excluding Petroleum and Gems & Jewellery during April-June 2025
SERVICES TRADE
Fig 7: Services Trade during June 2025*
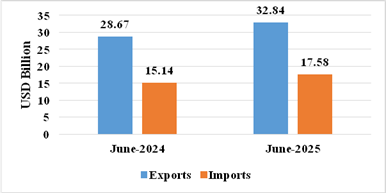
Fig 8: Services Trade during April-June 2025*