Second highest monthly Gross GST Revenue collection in March at ₹1.78 lakh crore; Records 11.5% y-o-y growth (18.4% on net basis)
Second highest monthly Gross GST Revenue collection in March at ₹1.78 lakh crore; Records 11.5% y-o-y growth (18.4% on net basis)
Gross Good and Services Tax (GST) revenue for March 2024 witnessed the second highest collection ever at ₹1.78 lakh crore, with a 11.5% year-on-year growth. This surge was driven by a significant rise in GST collection from domestic transactions at 17.6%. GST revenue net of refunds for March 2024 is ₹1.65 lakh crore which is growth of 18.4% over same period last year.
Strong Consistent Performance in FY 2023-24: FY 2023-24 marks a milestone with total gross GST collection of Rs. 20.18 lakh crore exceeding ₹20 lakh crore, a 11.7% increase compared to the previous year. The average monthly collection for this fiscal year stands at ₹1.68 lakh crore, surpassing the previous year’s average of ₹1.5 lakh crore. GST revenue net of refunds as of March 2024 for the current fiscal year is ₹18.01 lakh crore which is a growth of 13.4% over same period last year.
Positive Performance Across Components:
Breakdown of March 2024 Collections:
Similar positive trends are observed in the entire FY 2023-24 collections:
Inter-Governmental Settlement: In the month of March, 2024, the Central Government settled ₹43,264 crore to CGST and ₹37,704 crore to SGST from the IGST collected. This translates to a total revenue of ₹77,796 crore for CGST and ₹81,450 crore for SGST for March, 2024 after regular settlement. For the FY 2023-24, the central government settled ₹4,87,039 crore to CGST and ₹4,12,028 crore to SGST from the IGST collected.
The chart below shows trends in monthly gross GST revenues during the current year. Table-1 shows the state-wise figures of GST collected in each State during the month of March, 2024 as compared to March, 2023. Table-2 shows the state-wise figures of post settlement GST revenue of each State till the month of March, 2024.
Chart: Trends in GST Collection
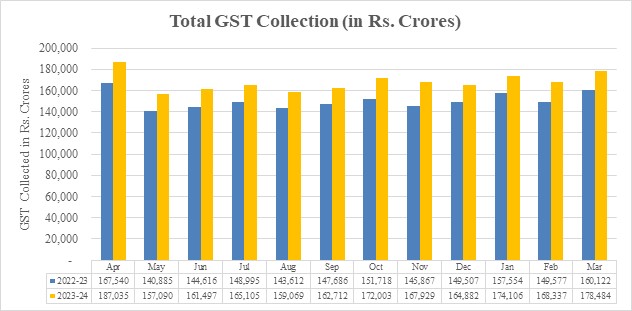
Table 1: State-wise growth of GST Revenues during March, 2024[1]
State/UT
Mar-23
Mar-24
Growth (%)
Jammu and Kashmir
477
601
26%
Himachal Pradesh
739
852
15%
Punjab
1,735
2,090
20%
Chandigarh
202
238
18%
Uttarakhand
1,523
1,730
14%
Haryana
7,780
9,545
23%
Delhi
4,840
5,820
20%
Rajasthan
4,154
4,798
15%
Uttar Pradesh
7,613
9,087
19%
Bihar
1,744
1,991
14%
Sikkim
262
303
16%
Arunachal Pradesh
144
168
16%
Nagaland
58
83
43%
Manipur
65
69
6%
Mizoram
70
50
-29%
Tripura
90
121
34%
Meghalaya
202
213
6%
Assam
1,280
1,543
21%
West Bengal
5,092
5,473
7%
Jharkhand
3,083
3,243
5%
Odisha
4,749
5,109
8%
Chhattisgarh
3,017
3,143
4%
Madhya Pradesh
3,346
3,974
19%
Gujarat
9,919
11,392
15%
Dadra and Nagar Haveli and Daman & Diu
309
452
46%
Maharashtra
22,695
27,688
22%
Karnataka
10,360
13,014
26%
Goa
515
565
10%
Lakshadweep
3
2
-18%
Kerala
2,354
2,598
10%
Tamil Nadu
9,245
11,017
19%
Puducherry
204
221
9%
Andaman and Nicobar Islands
37
32
-14%
Telangana
4,804
5,399
12%
Andhra Pradesh
3,532
4,082
16%
Ladakh
23
41
82%
Other Territory
249
196
-21%
Center Jurisdiction
142
220
55%
Grand Total
1,16,659
1,37,166
18%
Table-2: SGST & SGST portion of IGST settled to States/UTs April-March (Rs. in crore)
Pre-Settlement SGST
Post-Settlement SGST[2]
State/UT
2022-23
2023-24
Growth
2022-23
2023-24
Growth
Jammu and Kashmir
2,350
2,945
25%
7,272
8,093
11%
Himachal Pradesh
2,346
2,597
11%
5,543
5,584
1%
Punjab
7,660
8,406
10%
19,422
22,106
14%
Chandigarh
629
689
10%
2,124
2,314
9%
Uttarakhand
4,787
5,415
13%
7,554
8,403
11%
Haryana
18,143
20,334
12%
30,952
34,901
13%
Delhi
13,619
15,647
15%
28,284
32,165
14%
Rajasthan
15,636
17,531
12%
35,014
39,140
12%
Uttar Pradesh
27,366
32,534
19%
66,052
76,649
16%
Bihar
7,543
8,535
13%
23,384
27,622
18%
Sikkim
301
420
39%
839
951
13%
Arunachal Pradesh
494
628
27%
1,623
1,902
17%
Nagaland
228
307
35%
964
1,057
10%
Manipur
321
346
8%
1,439
1,095
-24%
Mizoram
230
273
19%
892
963
8%
Tripura
435
512
18%
1,463
1,583
8%
Meghalaya
489
607
24%
1,490
1,713
15%
Assam
5,180
6,010
16%
12,639
14,691
16%
West Bengal
21,514
23,436
9%
39,052
41,976
7%
Jharkhand
7,813
8,840
13%
11,490
12,456
8%
Odisha
14,211
16,455
16%
19,613
24,942
27%
Chhattisgarh
7,489
8,175
9%
11,417
13,895
22%
Madhya Pradesh
10,937
13,072
20%
27,825
33,800
21%
Gujarat
37,802
42,371
12%
58,009
64,002
10%
Dadra and Nagar Haveli and Daman and Diu
637
661
4%
1,183
1,083
-8%
Maharashtra
85,532
1,00,843
18%
1,29,129
1,49,115
15%
Karnataka
35,429
40,969
16%
65,579
75,187
15%
Goa
2,018
2,352
17%
3,593
4,120
15%
Lakshadweep
10
19
93%
47
82
75%
Kerala
12,311
13,967
13%
29,188
30,873
6%
Tamil Nadu
36,353
41,082
13%
58,194
65,834
13%
Puducherry
463
509
10%
1,161
1,366
18%
Andaman and Nicobar Islands
183
206
12%
484
528
9%
Telangana
16,877
20,012
19%
38,008
40,650
7%
Andhra Pradesh
12,542
14,008
12%
28,589
31,606
11%
Ladakh
171
250
46%
517
653
26%
Other Territory
201
231
15%
721
1,123
56%
Grand Total
4,10,251
4,71,195
15%
7,70,747
8,74,223
13%
****
YKB/VM/KMN