Railway Safety Initiatives Lead to 70% Decline in Train Accidents Since 2014
Railway Safety Initiatives Lead to 70% Decline in Train Accidents Since 2014
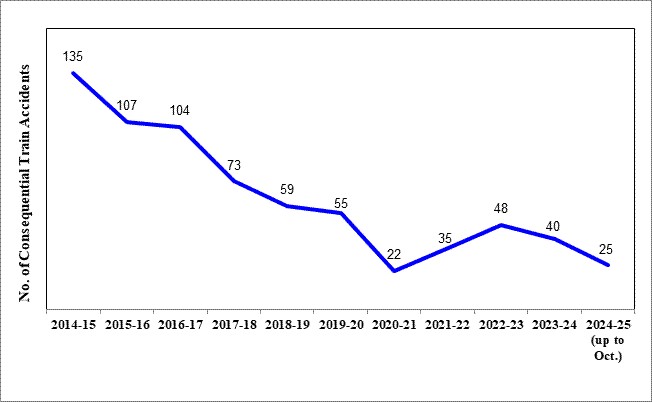
As a consequence of various safety measures taken over the years, there has been a steep decline in the number of accidents. Consequential Train Accidents have reduced from 135 in 2014-15 to 40 in 2023-24 as shown in the graph below. The causes of these accidents broadly include track defects, Loco/Coach defects, equipment failures, human errors etc.
It may be noted that the consequential train accidents during the period 2004-14 was 1711 (average 171 per annum), which has declined to 678 during the period 2014-24 (average 68 per annum).
Another important index showing improved safety in train operations is Accidents per Million Train Kilometer (APMTKM) which has reduced from 0.11 in 2014-15 to 0.03 in 2023-24, indicating an improvement of approx.73% during the said period.
Safety is accorded the highest priority on Indian Railways. The various safety measures taken to enhance safety in train operations are as under:-
Expenditure on Safety related activities (Rs. in Cr.)
2022-23 (Act)
2023-24(Act)
BE 2024-25
Maintenance of Permanent Way & Works
18,115
20,322
21,386
Maintenance of Motive Power and Rolling Stock
27,086
30,864
31,494
Maintenance of Machines
9,828
10,772
11,864
Road Safety LCs and ROBs/ RUBs
5,347
6,662
9,980
Track Renewals
16,326
17,850
17,652
Bridge Works
1,050
1,907
2,137
Signal & Telecom Works
2,456
3,751
4,647
Workshops Incl. PUs and Misc. expenditure on Safety
7,119
9,523
9,615
Total
87,327
1,01,651
1,08,776
The details of the Safety related works undertaken by Railways are tabulated below:-
SN
Item
2004-05 to 2013-14
2014-15 to 2023-24
2014-24 Vs. 2004-14
Track Maintenance
1.
Expenditure on Track Renewal (Rs. in Cr.)
47,038
1,09,577
2.33 times
2.
Rail Renewal Primary (Track Km)
32,260
43,335
1.34 times
3.
Use of high-quality rails (60 Kg) (Km)
57,450
1,23,717
2.15 times
4.
Longer Rail Panels (260m) (Km)
9,917
68,233
6.88 times
5.
USFD (Ultra Sonic Flaw detection) Testing of Rails (Track km)
20,19,630
26,52,291
1.31 times
6.
USFD (Ultra Sonic Flaw detection) Testing of Welds (Nos.)
79,43,940
1,73,06,046
2.17 times
7.
New Track KM added (Track km)
14,985
31,180
2.08 times
8.
Weld failures (Nos.)
In 2013-14: 3699
In 2023-24: 481
87% reduction
9.
Rail fractures (Nos.)
In 2013-14: 2548
In 2023-24: 383
85% reduction
10
Thick Web Switches (Nos.)
Nil
21,127
11
Track Machines (Nos.)
As on 31.03.14 = 748
As on 31.03.24 = 1,661
122% increase
Level Crossing Gate Elimination
1.
Elimination of Unmanned Level Crossing Gates (Nos.)
As on 31.03.14: 8948
As on 31.03.24: Nil (All eliminated by 31.01.19)
100% reduction
2.
Elimination of Manned Level Crossing Gates (Nos.)
1,137
7,075
6.21 Times
3.
Road over Bridges (RoBs)/ Road under Bridges (RUBs) (Nos.)
4,148
11,945
2.88 Times
4.
Expenditure on LC Elimination (LC+ROB+RUB)
8,825
41,957
4.75 Times
Bridge Rehabilitation
1.
Expenditure on Bridge Rehabilitation (Rs. in Cr.)
3,924
8,255
2.10 Times
Signalling Works
1.
Electronic Interlocking (Stations)
837
2,964
3.52 times
2.
Automatic Block Signaling (Km)
1,486
2,497
1.67 times
3.
Fog Pass Safety Devices (Nos.)
As on 31.03.14: 90
As on 31.03.24: 19,742
219 times
S N
Item
2004-05 to 2013-14
2014-15 to 2023-24
2014-24 Vs. 2004-14
Rolling Stock
1.
Manufacture of LHB Coaches (Nos.)
2,337
36,933
15.80 times
2.
Provision of Fire and Smoke Detection System in AC coaches (Nos. of Coaches)
0
19,271
3.
Provision of Fire Detection and Suppression System in Pantry and Power Cars (Nos. of Coaches)
0
2,991
4.
Provision of Fire Extinguishers in Non –AC coaches (Nos. of Coaches)
0
66,840
This information was given by the Union Minister of Railways, Information & Broadcasting and Electronics & Information Technology Shri Ashwini Vaishnaw in a written reply in Lok Sabha today.