Highlights of Telecom Subscription Data as on 31st December 2025
Highlights of Telecom Subscription Data as on 31st December 2025
Particulars
Wireless*
Wireline
Total
(Wireless+
Wireline)
Broadband Subscribers (Million)
962.07
45.29
1007.35
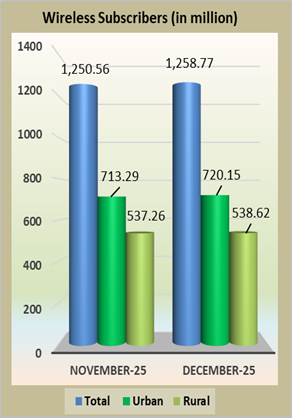
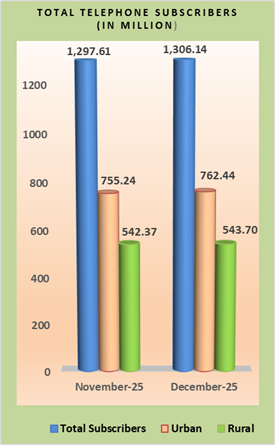
Urban Telephone Subscribers (Million)
720.15
42.29
762.44
Net Addition in December 2025 (Million)
6.86
0.34
7.20
Monthly Growth Rate
0.96%
0.82%
0.95%
Rural Telephone Subscribers (Million)
538.62
5.08
543.70
Net Addition in December 2025 (Million)
1.35
-0.03
1.33
Monthly Growth Rate
0.25%
-0.49%
0.25%
Total Telephone Subscribers (Million)
1258.77
47.37
1306.14
Net Addition in December 2025 (Million)
8.21
0.32
8.53
Monthly Growth Rate
0.66%
0.68%
0.66%
Share of Urban Subscribers
57.21%
89.27%
58.37%
Share of Rural Subscribers
42.79%
10.73%
41.63%
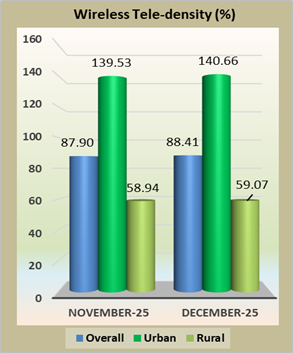
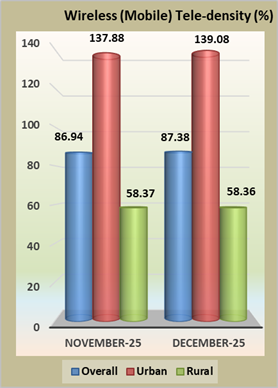
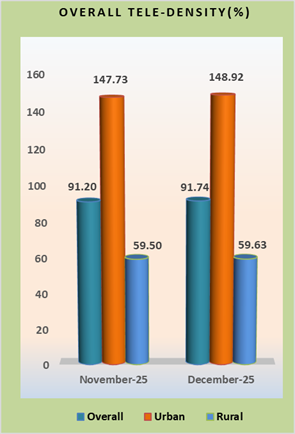
Overall Tele-density@ with M2M cellular mobile connections
88.41%
3.33%
91.74%
Urban Tele-density@
140.66%
8.26%
148.92%
Rural Tele-density@
59.07%
0.56%
59.63%
Tele-density@ without M2M cellular mobile connections
80.74%
3.33%
84.01%
Note:
* The wireless subscriber base comprises of wireless mobile telephone subscribers (including M2M cellular mobile connections), and FWA subscribers.
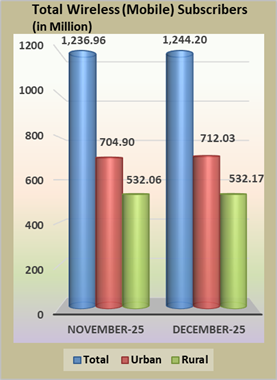
* Till the month of November 2025, M/s Bharti Airtel Limited did not include its M2M cellular subscriber base in its report on the wireless (mobile) subscriber base while the remaining operators were including their M2M cellular subscriber bases in their reports on the wireless (mobile) subscriber base. From the month of December 2025, M/s Bharti Airtel Limited has also started including its M2M cellular subscriber base in its report on the wireless (mobile) subscriber base. As a result, there has been a significant increase in the wireless (mobile) subscriber base in the month of December 2025.
@ In the reports published till the previous month, overall tele-density was computed by including M2M cellular mobile connections in the telephone subscriber base.
@ Tele-density has been computed on the basis of the projection of population from the ‘Report of the Technical Group on Population Projections for India and States 2011 – 2036’, published in July 2020.
# VLR is acronym of Visitor Location Register. The dates of peak VLR for various Telecom Service Providers (TSPs) may be different in different service areas.
Broadband Subscribers
Segment–wise Broadband Subscribers and Monthly Growth Rate in the month of December 2025
Segment
Subscription
Broadband Subscribers
(in million)
Percentage Change
November 2025
December 2025
Wired subscribers
Fixed Wired Access
(DSL, FTTx, Ethernet/LAN, Cable Modem, ILL)
45.11
45.29
0.39%
Wireless Subscribers
Fixed Wireless Access
(5G FWA, Wi-Fi, Wi-Max, Radio/UBR, Satellite)
14.06
14.77
5.04%
Mobile Wireless Access
(Handset/Dongle-based-3G, 4G, 5G)
944.48
947.30
0.30%
Total Broadband Subscribers
1003.65
1007.35
0.37%
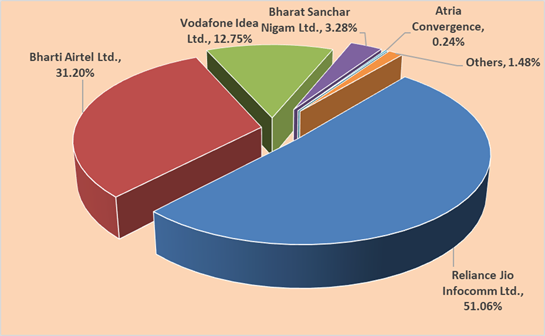
Top five Broadband (Wired & Wireless) Service providers as on 31st December 2025
S.N.
Service Provider
Subscriber base
(In million)
Reliance Jio Infocomm Ltd.
514.35
Bharti Airtel Ltd.*
314.26
Vodafone Idea Ltd.
128.47
Bharat Sanchar Nigam Ltd.
33.03
Atria Convergence Technologies Ltd.
2.37
Market Share of Top Five Broadband (Wired & Wireless) Service Providers
98.52%
(*) The report is prepared based on the last available internet subscription data (November 2025) submitted by M/s Bharti Airtel Ltd., as the internet subscription data for December 2025 was not submitted by the licensee, as prescribed.
Service Provider-wise Market Share of Broadband (Wired & Wireless) Services as on 31st December 2025
Top Five Fixed Wired Access Broadband Service providers as on 31st December 2025
S.N.
Service Provider
Subscriber base
(In million)
Reliance Jio Infocomm Ltd.
13.80
Bharti Airtel Ltd.
10.05
Bharat Sanchar Nigam Ltd
4.47
Atria Convergence Technologies Ltd.
2.37
Kerala Vision Broadband Ltd.
1.45
Market Share of Top Five Fixed (Wired) Access Broadband Service Providers
70.96%
Top five Wireless (Fixed wireless & mobile) Access Broadband Service providers as on 31st December 2025
S.N.
Service Provider
Subscriber base
(In million)
Reliance Jio Infocomm Ltd.
500.55
Bharti Airtel Ltd.
304.21
Vodafone Idea Ltd.
128.46
Bharat Sanchar Nigam Ltd.
28.56
IBus Virtual Network Services Private Limited
0.12
Market Share of Top Five Wireless (Fixed wireless & Mobile) Access Broadband Service providers
99.98%
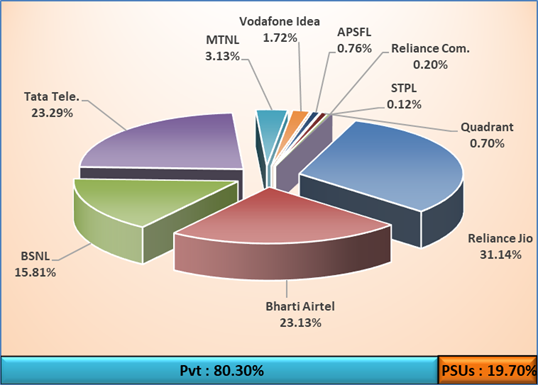
Access Service Provider-wise Market Share of Wireline Subscribers as on 31st December 2025
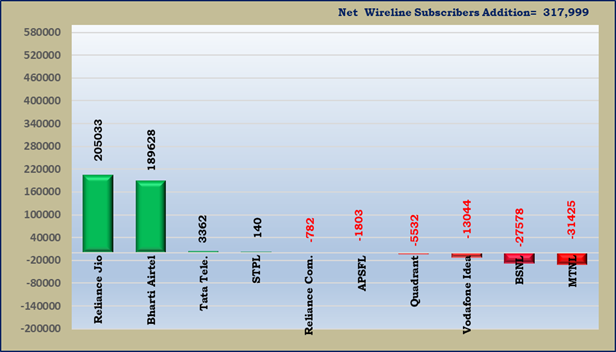
Access Service Provider-wise Net Addition/Decline in Wireline Subscribers during the month of December 2025
Note: In the calculation of Tele-density figures, M2M cellular mobile connections have also been considered.
(A) Wireless (mobile) subscriber Base
Note: In the calculation of Tele-density figures, M2M cellular mobile connections have also been considered.
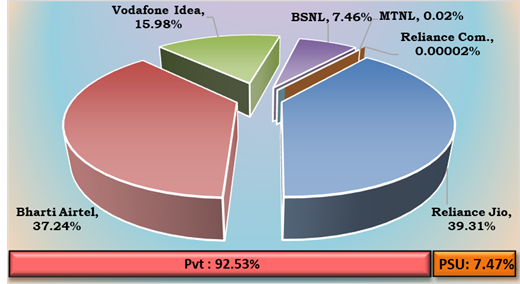
• As on 31st December 2025, the private access service providers held 92.53% of the market share in terms of wireless (mobile) subscribers, whereas PSU access service providers viz. BSNL and MTNL together held a market share of 7.47%.
The graphical representation of access service provider-wise market share and net additions in wireless (mobile) subscriber base are given below: –
Access Service Provider-wise Market Shares in term of Wireless (Mobile) Subscribers as on 31st December 2025
Net Addition/ Decline in Wireless (Mobile) Subscribers of Access Service Providers in the month of December 2025
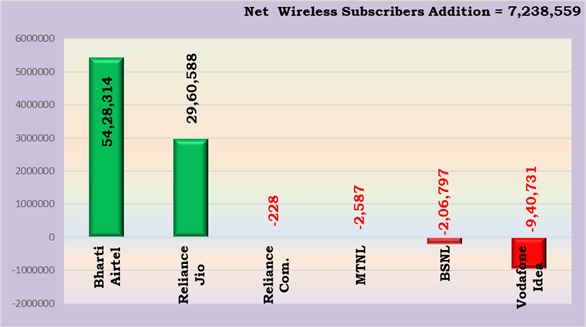
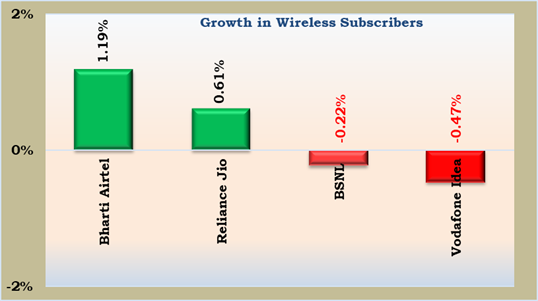
Growth in Wireless (Mobile) Subscribers
Major Access Service Provider-wise Monthly Growth/ Decline Rate of Wireless (Mobile) Subscribers in the month of December 2025
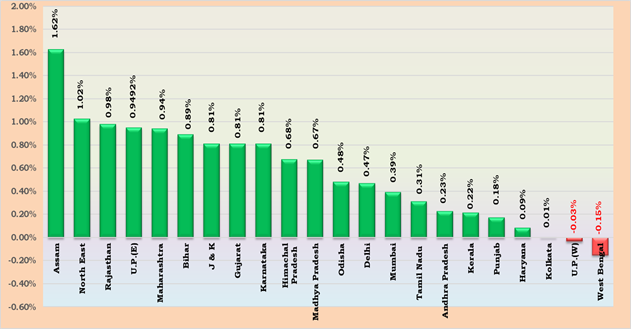
Licensed Service Area (LSA)-wise Monthly Growth/ Decline rate of Wireless (Mobile) Subscribers in the month of December 2025
(B) Wireless (FWA) subscriber Base
LSA wise information on the wireless (UBR FWA) subscriber base is available at Annexure-VI.
The Number of M2M cellular mobile connections increased from 103.48 million at the end of November 2025 to 109.19 million at the end of December 2025.
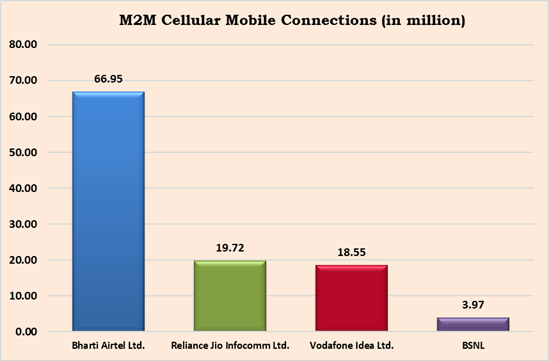
Bharti Airtel Limited has the highest number of M2M cellular mobile connections of 66.95 million with a market share of 61.31%, followed by Reliance Jio Infocomm Limited, Vodafone Idea Limited and BSNL with market share of 18.06%, 16.99% and 3.64% respectively.
Note: In the calculation of Tele-density figures, M2M cellular mobile connections have also been considered.
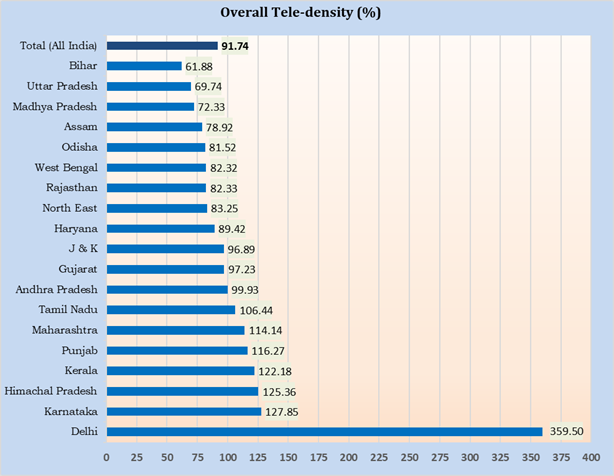
Overall Tele-density (LSA Wise) – As on 31st December 2025
Circle Category-wise Net Additions in Telephone Subscribers in the Month
of December 2025
Circle
Category
Net additions in the month of December 2025
Telephone Subscriber base as on 31st December 2025
Wireline segment
Wireless* segment
Wireline segment
Wireless* segment
Circle A
88,650
2,926,708
20,157,520
421,811,949
Circle B
131,627
2,692,069
11,530,876
490,730,691
Circle C
63,016
2,008,055
3,528,315
207,432,235
Metro
34,706
585,549
12,151,480
138,794,472
All India
317,999
8,212,381
47,368,191
1,258,769,347
Circle Category-wise Monthly and Yearly Growth Rates in
Telephone Subscribers in the Month of December 2025
Circle Category
Monthly growth rate (%) (November 2025 to December 2025)
Yearly growth rate (%) (December 2024 to December 2025)
Wireline Segment
Wireless* Segment
Wireline Segment
Wireless* Segment
Circle A
0.44%
0.70%
33.67%
7.57%
Circle B
1.15%
0.55%
3.25%
4.67%
Circle C
1.82%
0.98%
3.80%
8.02%
Metro
0.29%
0.42%
26.29%
8.64%
All India
0.68%
0.66%
20.63%
6.61%
* The wireless subscriber base comprises of wireless mobile telephone subscribers (including M2M cellular mobile connections), and FWA subscribers.
Note: Circle Category-Metro includes Delhi, Mumbai and Kolkata.
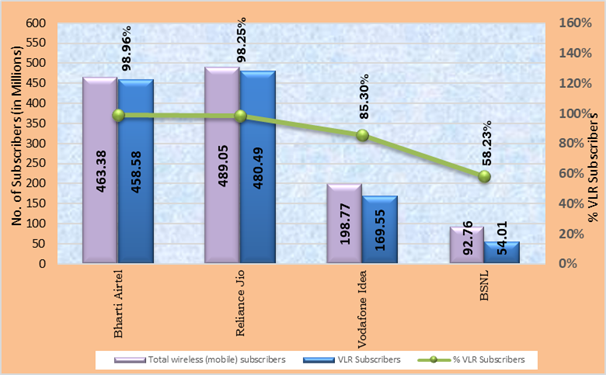
Percentage of VLR Subscribers for the Top Four Access Service Providers in the month of December 2025
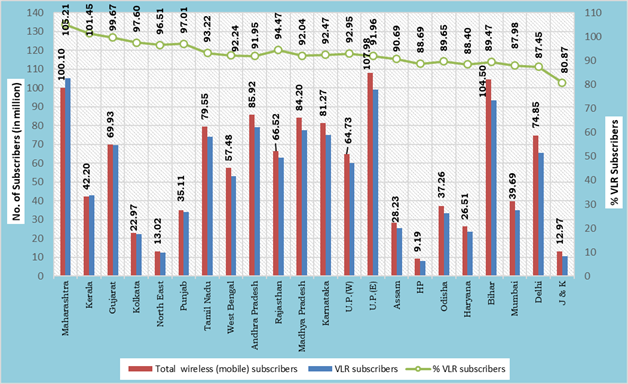
Service Area wise percentage of VLR Subscribers in the month of December 2025
Licensed Service Area Wise MNP Status (in million)
Zone-I
Zone–II
Service Area
Number of Porting Requests in
the month of
Service Area
Number of Porting Requests in
the month of
November-25
December-25
November-25
December-25
Delhi
0.66
0.75
Andhra Pradesh
0.68
0.69
Gujarat
1.00
1.15
Assam
0.12
0.13
Haryana
0.41
0.46
Bihar
1.33
1.45
Himachal Pradesh
0.06
0.06
Karnataka
0.61
0.63
Jammu & Kashmir
0.07
0.07
Kerala
0.26
0.25
Maharashtra
1.06
1.09
Kolkata
0.19
0.19
Mumbai
0.25
0.27
Madhya Pradesh
1.40
1.52
Punjab
0.35
0.40
North East
0.03
0.03
Rajasthan
0.78
0.93
Odisha
0.25
0.25
U.P.(East)
1.97
2.30
Tamil Nadu
0.62
0.65
U.P.(West)
1.35
1.56
West Bengal
1.26
1.29
Total
7.94
9.02
Total
6.74
7.10
Total (Zone-I + Zone-II)
14.69
16.12
Contact details in case of any clarification: –
Shri Akhilesh Kumar Trivedi, Advisor (NSL-II),
Telecom Regulatory Authority of India
World Trade Centre, Tower-F,
Nauroji Nagar, New Delhi – 110029
Ph: 011-20907758 (Pushpendra Kumar Singh)
E-mail: advmn@trai.gov.in I/C Pr. Advisor (NSL), TRAI
Note: Peak VLR figures in some LSAs of some of the service providers are more than their HLR figures due to a large number of inroamers.
Annexure IV
VLR Subscribers in the Wireless Segment
Home Location Register (HLR) is a central database that contains details of each mobile phone subscriber that is authorized to use the GSM core network. The HLRs store details of every SIM card issued by the service provider. Each SIM has a unique identifier called an International Mobile Subscriber Identity (IMSI), which is the primary key to each HLR record. The HLR data is stored for as long as a subscriber remains with the service provider. HLR also manages the mobility of subscribers by means of updating their position in administrative areas. It sends the subscriber data to a Visitor Location Register (VLR).
Subscriber numbers reported by the service providers is the difference between the numbers of IMSI registered in service provider’s HLR and sum of other figures as given below: –
1
Total IMSI’s in HLR (A)
2
Less: (B = a + b + c + d + e)
a.
Test/Service Cards
b.
Employees
c.
Stock in hand/in Distribution Channels (Active Card)
d.
Subscriber Retention period expired
e.
Service suspended pending disconnection
3
Subscribers Base (A-B)
Visitor Location Register (VLR) is a temporary database of the subscribers who have roamed into the particular area, which it serves. Each base station in the network is served by exactly one VLR; hence a subscriber cannot be present in more than one VLR at a time.
If subscriber is in active stage i.e. he is able to send/receive calls/SMSs he is available both in HLR and VLR. However, it may be possible that the subscriber is registered in HLR but not in VLR due to the reason that he is either switched-off or moved out of coverage area, not reachable etc. In such circumstances he will be available in HLR but not in VLR. This causes difference between subscriber number reported by the service providers based on HLR and numbers available in VLR.
The VLR subscriber data calculated here is based on active subscribers in VLR on the date of Peak subscriber number in VLR of the particular month for which the data is being collected. This data is to be taken from the switches having the purge time of not more than 72 hours.
Fixed-Wireless (5G) Subscribers Base
Annexure-V
5G-Fixed Wireless Subscribers
TSPs Name →
Bharti Airtel
Reliance Jio
Grand Total
↓Telecom Service Area
Nov-25
Dec-25
Nov-25
Dec-25
Nov-25
Dec-25
Andhra Pradesh
257,548
283,374
649,908
675,280
907,456
958,654
Assam
53,944
62,416
178,168
187,285
232,112
249,701
Bihar
123,880
144,522
621,699
650,469
745,579
794,991
Delhi
137,554
149,660
229,289
228,262
366,843
377,922
Gujarat
155,969
172,601
422,040
431,728
578,009
604,329
Haryana
74,090
80,353
216,664
222,578
290,754
302,931
Himachal Pradesh
13,104
14,884
72,734
75,076
85,838
89,960
Jammu & Kashmir
46,975
54,000
167,716
173,291
214,691
227,291
Karnataka
242,390
265,061
393,430
404,253
635,820
669,314
Kerala
52,925
58,412
167,426
177,190
220,351
235,602
Kolkata
80,459
86,228
159,893
160,300
240,352
246,528
Madhya Pradesh
119,531
135,682
518,163
539,118
637,694
674,800
Maharashtra
238,637
263,445
590,209
605,285
828,846
868,730
Mumbai
92,678
99,997
102,937
105,315
195,615
205,312
North East
29,534
33,584
82,420
85,273
111,954
118,857
Odisha
62,951
69,910
273,291
287,887
336,242
357,797
Punjab
128,737
143,221
466,746
480,085
595,483
623,306
Rajasthan
163,034
180,671
432,040
449,508
595,074
630,179
Tamil Nadu
336,051
371,118
355,938
369,097
691,989
740,215
Uttar Pradesh (East)
157,801
179,662
638,577
663,985
796,378
843,647
Uttar Pradesh (West)
124,512
139,478
494,597
512,846
619,109
652,324
West Bengal
73,579
83,537
412,257
437,777
485,836
521,314
TOTAL
2,765,883
3,071,816
7,646,142
7,921,888
10,412,025
10,993,704
Net Addition
305,933
275,746
581,679
Monthly Growth %
11.06%
3.61%
5.59%
Annexure-VI
Fixed-Wireless (UBR) Subscribers Base
UBR- Fixed Wireless Subscribers
TSPs Name →
Reliance Jio
↓Telecom Service Area
Nov-25
Dec-25
Andhra Pradesh
253,677
288,198
Assam
26,064
29,231
Bihar
214,052
241,585
Delhi
218,156
246,562
Gujarat
221,105
246,568
Haryana
145,809
161,976
Himachal Pradesh
8,012
9,280
Jammu & Kashmir
61,571
68,781
Karnataka
191,937
217,951
Kerala
8,290
8,914
Kolkata
136,949
156,494
Madhya Pradesh
183,781
208,332
Maharashtra
263,210
296,166
Mumbai
47,006
51,717
North East
11,158
12,357
Odisha
41,164
46,465
Punjab
192,084
212,875
Rajasthan
227,735
254,119
Tamil Nadu
138,298
153,714
Uttar Pradesh (East)
221,955
247,390
Uttar Pradesh (West)
277,550
311,756
West Bengal
97,700
108,975
TOTAL
3,187,263
3,579,406
Net Addition
392,143
Monthly Growth %
12.30%
*Only Reliance Jio Infocomm Limited has reported the information on the number of UBR FWA subscribers.