Highlights of Telecom Subscription Data as on 30th September 2025
Highlights of Telecom Subscription Data as on 30th September 2025
Particulars
Wireless*
Wireline
Total
(Wireless+
Wireline)
Broadband Subscribers (Million)
951.23
44.40
995.63
Urban Telephone Subscribers (Million)
647.47
41.64
689.11
Net Addition in August 2025 (Million)
2.20
0.12
2.32
Monthly Growth Rate
0.34%
0.28%
0.34%
Rural Telephone Subscribers (Million)
534.85
4.98
539.83
Net Addition in August 2025 (Million)
2.09
-0.01
2.08
Monthly Growth Rate
0.39%
-0.23%
0.39%
Total Telephone Subscribers (Million)
1182.32
46.61
1228.94
Net Addition in August 2025 (Million)
4.29
0.11
4.40
Monthly Growth Rate
0.36%
0.23%
0.36%
Overall Tele-density@(%)
83.36%
3.29%
86.65%
Urban Tele-density@(%)
126.62%
8.14%
134.76%
Rural Tele-density@(%)
58.98%
0.55%
59.52%
Share of Urban Subscribers
54.76%
89.32%
56.07%
Share of Rural Subscribers
45.24%
10.68%
43.93%
In the month of September 2025 15.13 million subscribers submitted their requests for Mobile Number Portability (MNP).
The Number of active wireless (Mobile) subscribers (on the date of peak VLR#) in September 2025 was 1088.59 million.
Note:
* Wireless includes Fixed Wireless Access (FWA) subscription also.
@ Based on the projection of population from the ‘Report of the Technical Group on Population Projections for India and States 2011 – 2036’.
# VLR is acronym of Visitor Location Register. The dates of peak VLR for various telecom service providers (TSPs) are different in different service areas.
Information in this Press Release is based on the data provided by the TSPs to TRAI.
Broadband Subscribers
As per the information received from 1392 operators in September 2025, the total number of broadband subscribers increased from 989.58 million at the end of August 2025 to 995.63 million at the end of September 2025 with a monthly growth rate of 0.61%. Segment-wise number of broadband subscribers and their monthly growth rates are as below: –
Segment–wise Broadband Subscribers and Monthly Growth Rate in the month of August 2025
Segment
Subscription
Broadband Subscribers
(in million)
Percent Change
August-2025
September-2025
Wired subscribers
Fixed (wired) Access
(DSL, FTTx, Ethernet/LAN, Cable Modem, ILL)
44.07
44.40
0.75%
Wireless Subscribers
Fixed Wireless Access
(5G FWA, Wi-Fi, Wi-Max, Radio/UBR, Satellite)
11.40
12.31
7.99%
Mobile Wireless Access
(Handset/Dongle based-3G, 4G, 5G)
934.11
938.92
0.51%
Total Broadband Subscribers
989.58
995.63
0.61%
Top five Broadband (Wired + Wireless) Service providers as on 30th September 2025
S.N.
Name of the Service Provider
Subscriber base
(In million)
Reliance Jio Infocomm Ltd.
505.47
Bharti Airtel Ltd.
310.42
Vodafone Idea Ltd.
127.78
Bharat Sanchar Nigam Ltd.
34.71
Atria Convergence Technologies Ltd.
2.34
Market Share of Top Five Broadband (Wired+Wireless) Service Providers
98.50%
The graphical representation of the service provider-wise market share of broadband services is given below: –
Service Provider-wise Market Share of Broadband (wired + wireless) Services as on 30th September 2025
Top Five Fixed (Wired) Access Broadband Service providers as on 30th September 2025
S.N.
Name of the Service Provider
Subscriber base
(In million)
Reliance Jio Infocomm Ltd.
13.20
Bharti Airtel Ltd.
9.80
Bharat Sanchar Nigam Ltd
4.40
Atria Convergence Technologies Ltd.
2.34
Kerala Vision Broadband Ltd.
1.42
Market Share of Top Five Fixed (Wired) Access Broadband Service Providers
70.19%
Top five Wireless (Fixed wireless & mobile) Access
Broadband Service providers as on 30th September 2025
S.N.
Name of the Service Provider
Subscriber base
(In million)
Reliance Jio Infocomm Ltd.
492.27
Bharti Airtel Ltd.
300.62
Vodafone Idea Ltd.
127.77
Bharat Sanchar Nigam Ltd..
30.31
IBus Virtual Network Services Private Limited
0.12
Market Share of Top Five Wireless (Fixed wireless & Mobile) Access Broadband Service providers
99.99%
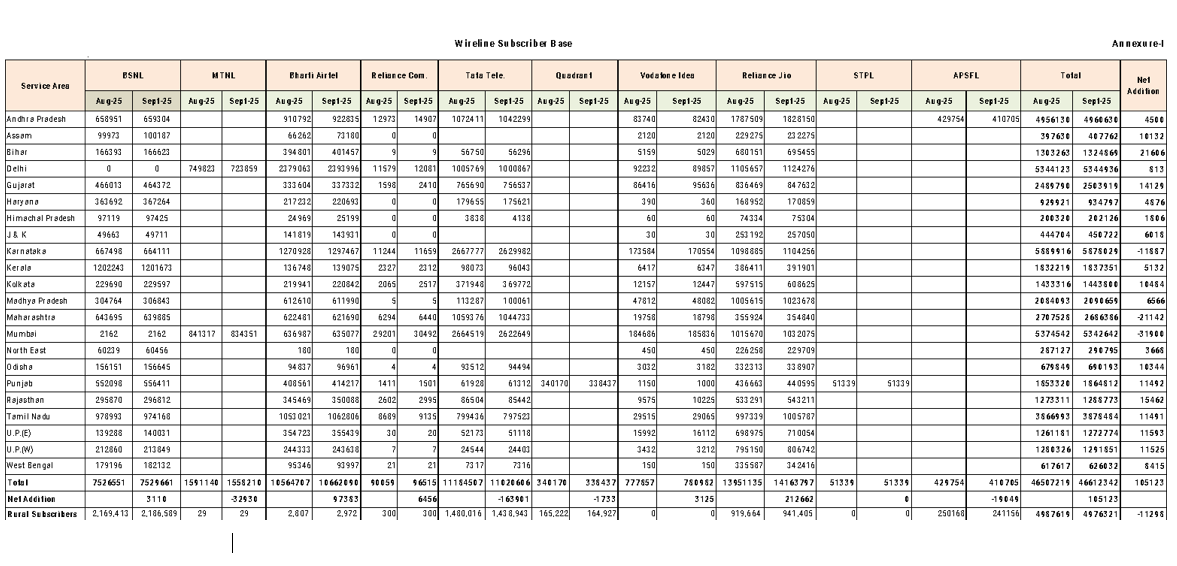
Wireline Telephone Subscriber Base
The number of wireline subscribers increased from 46.51 million at the end of August 2025 to 46.61 million at the end of September 2025. The net increase in the wireline subscriber base was 0.11 million with a monthly growth rate of 0.23%.
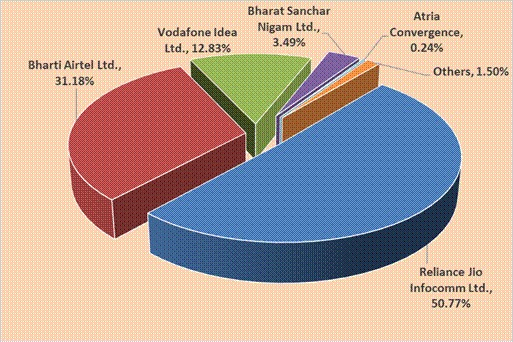
The overall wireline tele-density in India increased from 3.28% at the end of August 2025 to 3.29% at the end of September 2025. Urban and rural wireline tele-density were 8.14% and 0.55% respectively, on 30th September 2025. The respective share of urban subscribers, and rural subscribers in total wireline subscribers were 89.32% and 10.68% respectively at the end of September 2025.
PSU access service providers viz. BSNL, MTNL, and APSFL together held 20.38% of the wireline market share as on 30th September 2025. Detailed statistics of the wireline subscriber base are available at Annexure-I.
Access Service Provider-wise Market Share of wireline Subscribers
as on 31st August 2025
EMNU.jpeg)
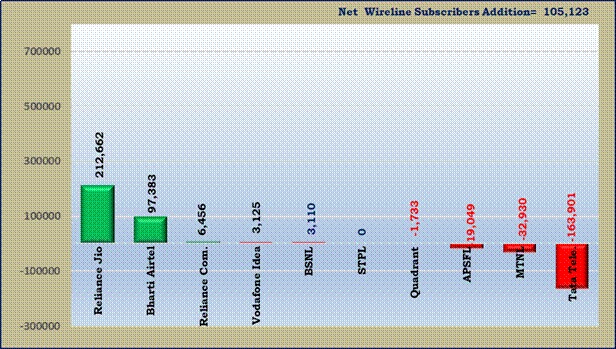
The net addition/ decline in the wireline subscriber base of various access service providers in the month of September 2025 is given below:
Access Service Provider-wise Net Addition/Decline in Wireline Subscribers during the month of September 2025
Wireless Telephone (Mobile + FWA) Subscriber Base
The number of wireless (mobile + Fixed wireless access) subscribers increased from 1178.03 million at the end of August 2025 to 1182.32 million at the end of September 2025, thereby registering a monthly growth rate of 0.36%. Total wireless subscription in urban areas increased from 645.27 million on 31st August 2025 to 647.47 million on 30th September 2025. The subscription in rural areas also increased from 532.76 million to 534.85 million during the same period. The monthly growth rate of urban and rural wireless subscriptions was 0.34% and 0.39%, respectively.
J4A4.jpeg)
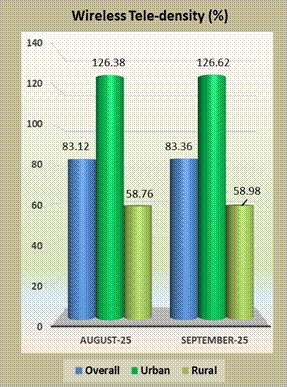
The wireless tele-density in India increased from 83.12% at the end of August 2025 to 83.36% at the end of September 2025. The urban wireless tele-density increased from 126.38% at the end of August 2025 to 126.62% at the end of September 2025. The rural wireless tele-density increased from 58.76% to 58.98% during the same period. The share of urban and rural wireless subscribers in the total number of wireless subscribers was 54.76% and 45.24%, respectively, at the end of September 2025.
The details of Wireless (mobile) subscribers and Wireless (FWA) subscribers are given below:
(A) Wireless (mobile) subscriber Base
58RW.jpeg)
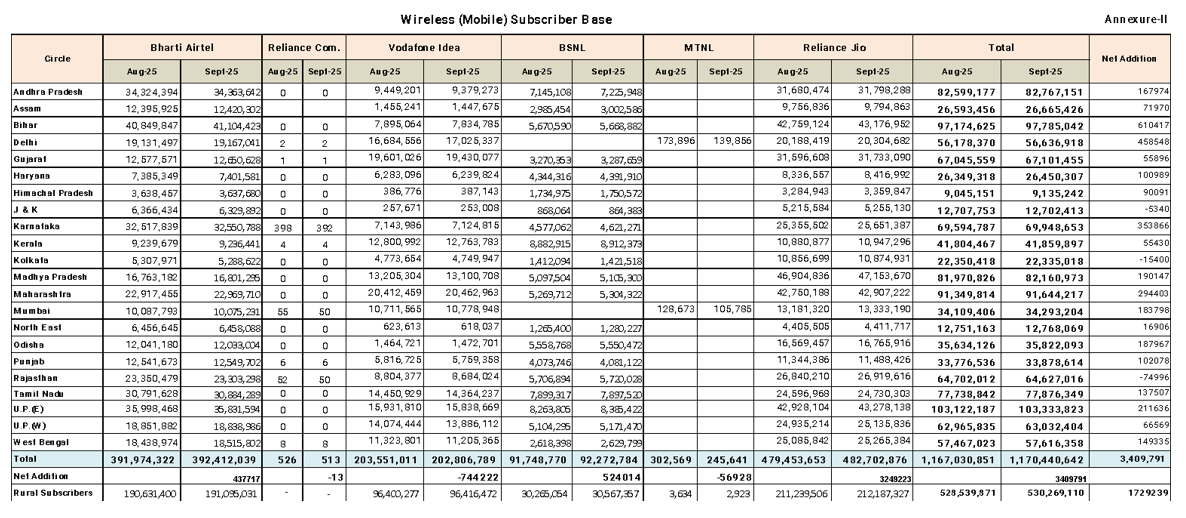
The number of wireless (mobile) subscribers increased from 1167.03 million at the end of August 2025 to 1170.44 million at the end of September 2025 thereby registering a monthly growth rate of 0.29%. Wireless (mobile) subscription in urban areas increased from 638.49 million at the end of August 2025 to 640.17 million at the end of September 2025 and wireless (mobile) subscription in rural areas also increased from 528.54 million to 530.27 million during the same period. The monthly growth rates of urban and rural wireless (mobile) subscription were 0.26% and 0.33% respectively.
BB2R.jpeg)
The wireless (mobile) tele-density in India increased from 82.35% at the end of August 2025 to 82.53% at the end of September 2025. The urban wireless (mobile) tele-density increased from 125.05% at the end of August 2025 to 125.19% at the end of September 2025 and rural wireless (mobile) tele-density increased from 58.30% to 58.47% during the same period. The share of urban and rural wireless (mobile) subscribers in the total number of wireless (mobile) subscribers were 54.69% and 45.31% respectively at the end of September 2025.
The detailed statistics of wireless (mobile) subscriber base is available at Annexure-II.
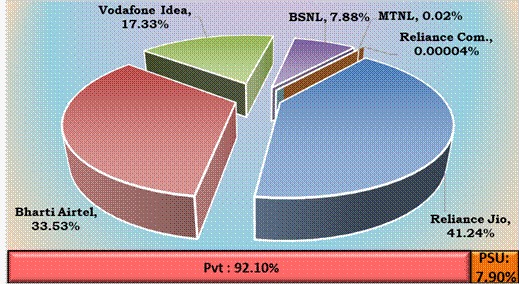
• As on 30th September 2025 the private access service providers held 92.10% of the wireless (mobile) subscribers, whereas PSU access service providers viz. BSNL and MTNL together held a market share of 7.90%.
The graphical representation of access service provider-wise market share and net additions in wireless (mobile) subscriber base are given below: –
Access Service Provider-wise Market Shares in term of Wireless (Mobile) Subscribers as on 30th September 2025
Net Addition/ Decline in Wireless (Mobile) Subscribers of Access Service Providers in the month of September 2025
GO53.jpeg)
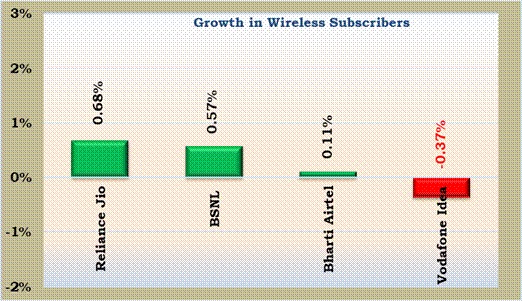
Growth in Wireless (Mobile) Subscribers
Major Access Service Provider-wise Monthly Growth/ Decline Rate of Wireless (Mobile) Subscribers in the month of September 2025
Service Area-wise Monthly Growth/ Decline Rate of Wireless (Mobile) Subscribers in the month of September 2025
V8QO.jpeg)
Except Jammu and Kashmir (J&K), Kolkata and Rajasthan, all other service areas have shown growth in their wireless (Mobile) subscribers during the month of September 2025.
(B) Wireless (FWA) subscriber Base
At present, fixed wireless access (FWA) based services are being provided under two categories viz.
5G FWA i.e. FWA using 5G radio access technology; and
UBR FWA i.e. FWA using unlicensed band radio (UBR) technology.
The number of wireless (5G FWA) subscribers increased from 8.90 million at the end of August 2025 to 9.40 million at the end of September 2025 with subscriptions in urban and rural areas of 5.53 million and 3.87 million, respectively. The shares of urban and rural wireless (5G FWA) subscribers in total wireless (5G FWA) subscribers were 58.85% and 41.15%, respectively at the end of September 2025.
Information on the wireless (5G FWA) subscriber base is available at Annexure-V.
Reliance Jio Infocomm Limited have started reporting the number of UBR FWA subscribers w.e.f. the month of August 2025.
UBR FWA subscription stood at 2.48 million at the end of September 2025 with subscriptions in urban and rural areas of 1.77 million and 0.71 million, respectively. The shares of urban and rural wireless (UBR FWA) subscribers in total wireless (UBR FWA) subscribers were 71.30% and 28.70%, respectively at the end of September 2025.
Information on the wireless (UBR FWA) subscriber base is available at Annexure-VI.
M2M cellular mobile connections
The Number of M2M cellular mobile connections increased from 89.70 million at the end of August 2025 to 94.57 million at the end of September 2025.
4TGG.jpeg)
Bharti Airtel Limited has the highest number of M2M cellular mobile connections of 56.33 million with a market share of 59.56%, followed by Vodafone Idea Limited, Reliance Jio Infocomm Limited and BSNL with market share of 18.79%, 17.84% and 3.81% respectively.
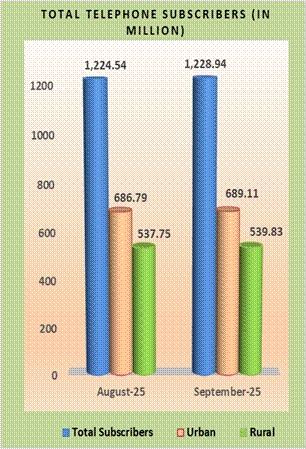
Total Telephone Subscriber Base
The number of total telephone subscribers in India increased from 1224.54 million at the end of August 2025 to 1228.94 million at the end of September 2025, thereby showing a monthly growth rate of 0.36%. Urban telephone subscription increased from 686.79 million at the end of August 2025 to 689.11 million at the end of September 2025 and the rural telephone subscription also increased from 537.75 million to 539.83 million during the same period. The monthly growth rates of urban and rural telephone subscription were 0.34% and 0.39% respectively during the month of September 2025.
0WAN.jpeg)
The overall tele-density in India increased from 86.40% at the end of August 2025 to 86.65% at the end of September 2025. The urban tele-density increased from 134.51% at the end of August 2025 to 134.76% at the end of September 2025 and rural tele-density also increased from 59.31% to 59.52% during the same period. The share of urban and rural subscribers in total number of telephone subscribers at the end of September 2025 were 56.07% and 43.93% respectively.
Overall Tele-density (LSA Wise) – As on 30th September 2025
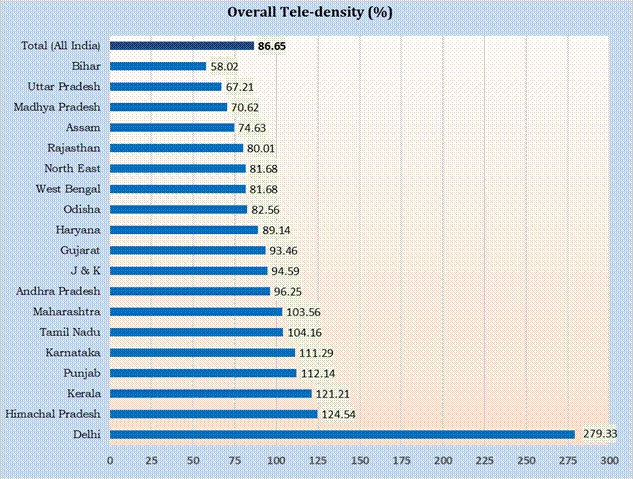
As may be seen in the above chart, eight LSA have less tele-density than the all-India average tele-density at the end of September 2025. Delhi service area has the maximum tele-density of 279.33% and the Bihar service area has the minimum tele-density of 58.02% at the end of September 2025.
Notes: –
Population data/projections are available state wise only.
Tele-density figures are derived from the telephone subscriber data provided by the access service providers and the projection of population from the “Report of the Technical Group on Population Projections for India and States 2011 – 2036.
Telephone subscriber data for Delhi, includes, apart from the data for the State of Delhi, wireless subscriber data for the areas served by the local exchanges of Ghaziabad & Noida (in Uttar Pradesh) and Gurgaon & Faridabad (in Haryana).
Data/information for West Bengal includes Kolkata, Maharashtra includes Mumbai and Uttar Pradesh includes UPE & UPW service area(s).
Data/information for Andhra Pradesh includes Telengana, Madhya Pradesh includes Chhatishgarh, Bihar includes Jharkhand, Maharashtra includes Goa, Uttar Pradesh includes Uttarakhand, West Bengal includes Sikkim and North-East includes Arunachal Pradesh, Manipur, Meghalaya, Mizoram, Nagaland & Tripura States.
Category-wise Growth in subscriber base
Circle Category-wise Net Additions in Telephone Subscribers in the month of September 2025
Circle
Category
Net additions in the month of September 2025
Telephone Subscriber base as on 30th September 2025
Wireline segment
Wireless* segment
Wireline segment
Wireless* segment
Circle A
-2909
1297599
19907448
393464086
Circle B
75061
1183913
11207049
477832108
Circle C
53574
1118830
3366467
196689946
Metro
-20603
693744
12131378
114338051
All India
105123
4294086
46612342
1182324191
*Wireless includes FWA subscription also
Circle Category-wise monthly and yearly Growth Rates in Telephone Subscribers in the month of September 2025
Circle Category
Monthly growth rate (%) (August 2025 to September 2025)
Yearly growth rate (%) (September 2024 to September 2025)
Wireline Segment
Wireless* Segment
Wireline Segment
Wireless* Segment
Circle A
-0.01%
0.33%
39.30%
1.22%
Circle B
0.67%
0.25%
9.98%
0.51%
Circle C
1.62%
0.57%
9.83%
3.38%
Metro
-0.17%
0.61%
29.25%
-0.20%
All India
0.23%
0.36%
26.21%
1.14%
*Wireless includes FWA subscription also
Note: Circle Category-Metro includes Delhi, Mumbai and Kolkata.
As can be seen in the above tables, in the wireless segment, during the month of September 2025, on a monthly basis, all circles have registered a growth in their subscriber bases. On a yearly basis, except ‘Metro’, all other circles have registered a growth in their subscriber bases.
In the wireline segment, during the month of September 2025 on a monthly basis ‘circle A’ and ‘Metro’ have registered a decline in their subscriber bases and on a yearly basis, all circles have registered a growth in their subscriber bases.
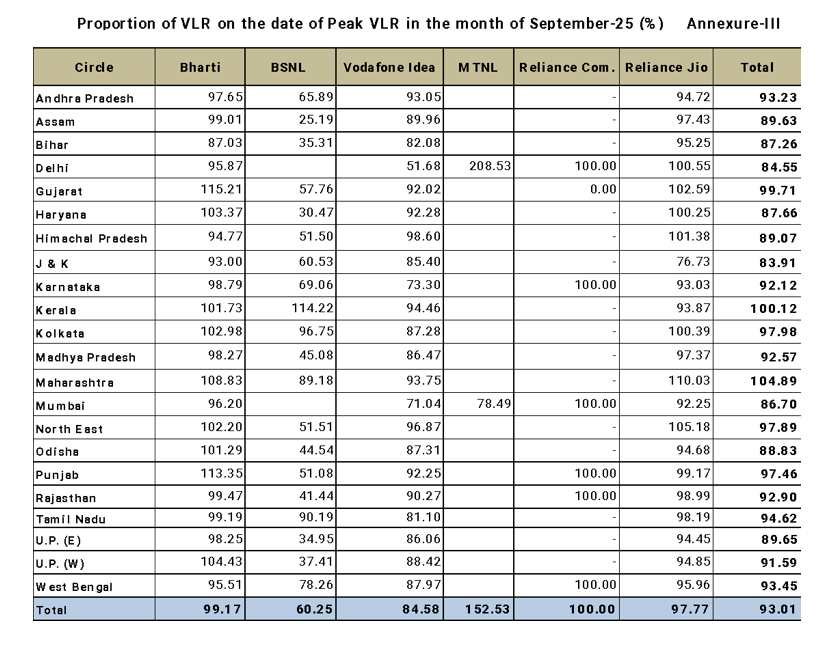
Active Wireless (Mobile) Subscribers (VLR Data)
Out of the total 1170.44 million wireless (mobile) subscribers, 1088.59 million wireless (mobile) subscribers were active on the date of peak VLR in the month of September 2025. The proportion of active wireless (mobile) subscribers was approximately 93.01% of the total wireless (mobile) subscriber base.
The detailed statistics on proportion of active wireless subscribers (also referred to as VLR subscribers) on the date of peak VLR in the month of September 2025 is available at Annexure-III and the methodology used for reporting VLR subscribers is available at Annexure-IV.
Access Service Provider-wise Percentage of VLR Subscribers
in the month of September 2025
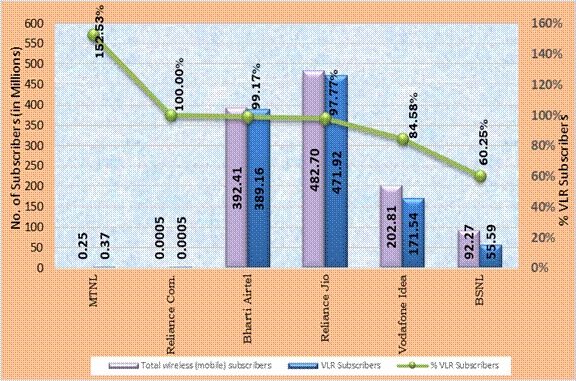
MTNL has the maximum proportion 152.53% of its active wireless (mobile) subscribers (VLR) as against its total wireless (mobile) subscribers (HLR) on the date of peak VLR in the month of September 2025. BSNL has the minimum proportion of VLR as 60.25% of its HLR during the same period.
Service Area wise percentage of VLR Subscribers
in the month of September 2025
ZE87.jpeg)
Mobile Number Portability (MNP)
MNP was implemented in Haryana Licensed Service Area (LSA) with effect from 25.11.2010 and across rest of the country with effect from 20.01.2011. Initially, it was available only within the same LSA. Inter-LSA MNP was introduced nationwide with effect from 03.07.2015, enabling wireless subscribers to retain their mobile numbers when they relocate from one service area to another.
During the month of September 2025, about 15.13 million subscribers submitted their requests for MNP. Out of total requests, number of requests received from Zone-I & Zone-II were about 8.45 million and 6.68 million respectively.
In MNP Zone-I (Northern and Western India), the highest number of requests have been received in UP(East) LSA (about 2.08 million) followed by U.P.(West) LSA (about 1.45 million).
In MNP Zone-II (Southern and Eastern India), the highest number of requests have been received in Bihar LSA (about 1.41 million) followed by Madhya Pradesh LSA (about 1.39 million).
Service Area Wise MNP Status (All figures in million)
Zone-I
Zone–II
Service Area
Number of Porting Requests in
the month of
Service Area
Number of Porting Requests in
the month of
August-25
September-25
August-25
September-25
Delhi
0.69
0.75
Andhra Pradesh
0.66
0.70
Gujarat
1.03
1.02
Assam
0.13
0.12
Haryana
0.45
0.45
Bihar
1.30
1.41
Himachal Pradesh
0.05
0.06
Karnataka
0.60
0.63
Jammu & Kashmir
0.07
0.07
Kerala
0.28
0.25
Maharashtra
1.06
1.06
Kolkata
0.20
0.19
Mumbai
0.28
0.28
Madhya Pradesh
1.45
1.39
Punjab
0.39
0.41
North East
0.03
0.03
Rajasthan
0.80
0.80
Odisha
0.25
0.24
U.P.(East)
2.09
2.08
Tamil Nadu
0.60
0.60
U.P.(West)
1.52
1.45
West Bengal
1.12
1.12
Total
8.42
8.45
Total
6.62
6.68
Total (Zone-I + Zone-II)
15.05
15.13
Contact details in case of any clarification: –
Shri Akhilesh Kumar Trivedi, Advisor (NSL-II),
Telecom Regulatory Authority of India
World Trade Centre, Tower-F,
Nauroji Nagar, New Delhi – 110029
Ph: 011-20907758 (S. B. Singh)
E-mail: advmn@trai.gov.in Pr. Advisor (NSL), TRAI
Note: Peak VLR figures in some circles of some of the service providers are more than their HLR figures due to a large number of inroamers.
Annexure IV
VLR Subscribers in the Wireless Segment
Home Location Register (HLR) is a central database that contains details of each mobile phone subscriber that is authorized to use the GSM core network. The HLRs store details of every SIM card issued by the service provider. Each SIM has a unique identifier called an International Mobile Subscriber Identity (IMSI), which is the primary key to each HLR record. The HLR data is stored for as long as a subscriber remains with the service provider. HLR also manages the mobility of subscribers by means of updating their position in administrative areas. It sends the subscriber data to a Visitor Location Register (VLR).
Subscriber numbers reported by the service providers is the difference between the numbers of IMSI registered in service provider’s HLR and sum of other figures as given below: –
1
Total IMSI’s in HLR (A)
2
Less: (B = a + b + c + d + e)
a.
Test/Service Cards
b.
Employees
c.
Stock in hand/in Distribution Channels (Active Card)
d.
Subscriber Retention period expired
e.
Service suspended pending disconnection
3
Subscribers Base (A-B)
Visitor Location Register (VLR) is a temporary database of the subscribers who have roamed into the particular area, which it serves. Each base station in the network is served by exactly one VLR; hence a subscriber cannot be present in more than one VLR at a time.
If subscriber is in active stage i.e. he is able to send/receive calls/SMSs he is available both in HLR and VLR. However, it may be possible that the subscriber is registered in HLR but not in VLR due to the reason that he is either switched-off or moved out of coverage area, not reachable etc. In such circumstances he will be available in HLR but not in VLR. This causes difference between subscriber number reported by the service providers based on HLR and numbers available in VLR.
The VLR subscriber data calculated here is based on active subscribers in VLR on the date of Peak subscriber number in VLR of the particular month for which the data is being collected. This data is to be taken from the switches having the purge time of not more than 72 hours.
Annexure-V
Fixed-Wireless (5G) Subscribers Base
Licensed Service Area
Bharti Airtel
Reliance Jio
Grand Total
Aug-25
Sep-25
Aug-25
Sep-25
Aug-25
Sep-25
Andhra Pradesh
195,960
215,756
573,123
599,670
769,083
815,426
Assam
40,624
44,183
152,880
161,179
193,504
205,362
Bihar
85,980
96,264
525,129
561,780
611,109
658,044
Delhi
113,891
121,247
229,208
229,582
343,099
350,829
Gujarat
122,558
132,207
387,552
399,551
510,110
531,758
Haryana
59,338
64,018
195,556
203,503
254,894
267,521
Himachal Pradesh
9,695
10,676
62,206
65,953
71,901
76,629
Jammu & Kashmir
35,003
38,231
150,144
156,266
185,147
194,497
Karnataka
190,348
204,945
363,327
374,894
553,675
579,839
Kerala
39,504
43,696
139,760
149,111
179,264
192,807
Kolkata
67,843
71,499
156,257
157,683
224,100
229,182
Madhya Pradesh
91,576
99,215
452,663
477,045
544,239
576,260
Maharashtra
185,785
200,813
532,893
552,265
718,678
753,078
Mumbai
75,632
80,554
95,525
98,010
171,157
178,564
North East
21,709
24,011
73,208
76,636
94,917
100,647
Odisha
47,296
51,423
226,688
243,924
273,984
295,347
Punjab
99,479
108,409
419,972
436,901
519,451
545,310
Rajasthan
127,478
138,232
381,286
399,165
508,764
537,397
Tamil Nadu
262,278
281,917
326,039
336,760
588,317
618,677
Uttar Pradesh (East)
117,839
129,356
550,049
582,744
667,888
712,100
Uttar Pradesh (West)
94,590
103,117
435,985
458,132
530,575
561,249
West Bengal
54,164
59,707
331,841
362,568
386,005
422,275
TOTAL
2,138,570
2,319,476
6,761,291
7,083,322
8,899,861
9,402,798
Net Addition
180,906
322,031
502,937
Monthly Growth %
8.46%
4.76%
5.65%
Annexure-VI
Fixed-Wireless (UBR) Subscribers Base
Licensed Service Area
Reliance Jio *
Aug-25
Sep-25
Andhra Pradesh
157,025
190,118
Assam
17,555
20,701
Bihar
139,818
167,960
Delhi
144,120
170,518
Gujarat
152,408
176,582
Haryana
94,995
112,972
Himachal Pradesh
4,677
5,933
Jammu & Kashmir
39,283
46,375
Karnataka
120,346
145,001
Kerala
6,550
7,106
Kolkata
89,559
105,141
Madhya Pradesh
115,637
138,837
Maharashtra
172,621
203,764
Mumbai
34,078
38,677
North East
7,096
8,623
Odisha
25,851
31,543
Punjab
133,799
154,435
Rajasthan
154,604
179,469
Tamil Nadu
96,045
112,018
Uttar Pradesh (East)
150,701
176,285
Uttar Pradesh (West)
179,922
213,255
West Bengal
62,703
75,438
TOTAL
2,099,393
2,480,751
Net Addition
381,358
Monthly Growth %
18.17%
* Only Reliance Jio has reported FWA-UBR Subscriber Base