Highest monthly merchandise exports, in the current FY so far, recorded in February 2024. India’s merchandise exports in February 2024 stands at USD 41.40 Billion; an increase of 11.86% over USD 37.01 Billion in February 2023
Highest monthly merchandise exports, in the current FY so far, recorded in February 2024. India’s merchandise exports in February 2024 stands at USD 41.40 Billion; an increase of 11.86% over USD 37.01 Billion in February 2023
February 2024
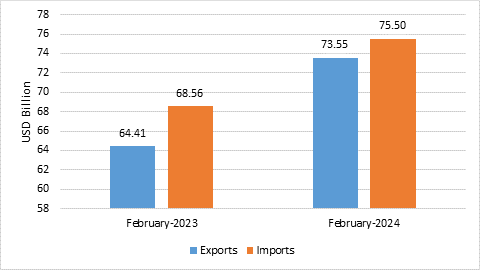
India’s overall exports (Merchandise and Services combined) in February 2024* is estimated to be USD 73.55 Billion, exhibiting a positive growth of 14.20 per cent over February 2023. Overall imports in February 2024* is estimated to be USD 75.50 Billion, exhibiting a positive growth of 10.13 per cent over February 2023.
Table 1: Trade during February 2024*
February 2024
(USD Billion)
February 2023
(USD Billion)
Merchandise
Exports
41.40
37.01
Imports
60.11
53.58
Services*
Exports
32.15
27.40
Imports
15.39
14.97
Overall Trade
(Merchandise +Services) *
Exports
73.55
64.41
Imports
75.50
68.56
Trade Balance
-1.95
-4.15
* Note: The latest data for services sector released by RBI is for January 2024. The data for February 2024 is an estimation, which will be revised based on RBI’s subsequent release. (ii) Data for April-February 2022-23 and April-September 2023 has been revised on pro-rata basis using quarterly balance of payments data.
Fig 1: Overall Trade during February 2024*
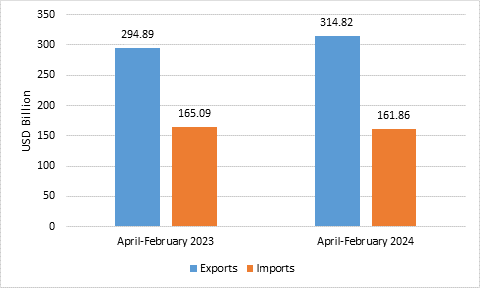
India’s overall exports (Merchandise and Services combined) in April-February 2023-24* are estimated to be USD 709.81 Billion, exhibiting a positive growth of 0.83 per cent over April-February 2022-23. Overall imports in April-February 2023-24* are estimated to be USD 782.05 Billion, exhibiting a negative growth of (-) 4.64 per cent over April-February 2022-23.
Table 2: Trade during April-February 2023-24*
April-February
2023-24
(USD Billion)
April-February
2022-23
(USD Billion)
Merchandise
Exports
394.99
409.11
Imports
620.19
655.05
Services*
Exports
314.82
294.89
Imports
161.86
165.09
Overall Trade
(Merchandise+ Services)*
Exports
709.81
704.00
Imports
782.05
820.14
Trade Balance
-72.24
-116.13
Fig 2: Overall Trade during April-February 2023-24*
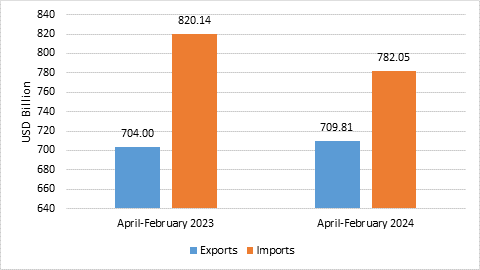
Fig 3: Merchandise Trade during February 2024
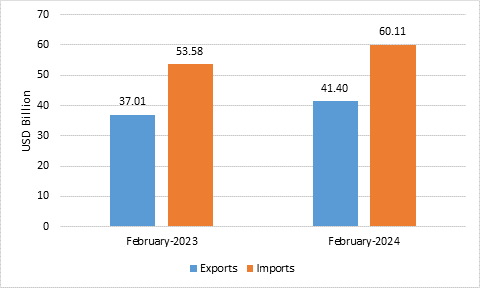
Fig 4: Merchandise Trade during April-February 2023-24
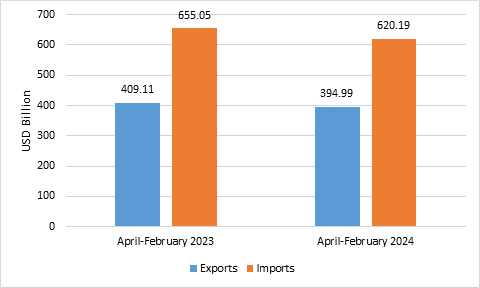
Table 3: Trade excluding Petroleum and Gems & Jewellery during February 2024
(USD Billion)
February 2023
(USD Billion)
Non- petroleum exports
33.17
29.17
Non- petroleum imports
43.22
36.70
Non-petroleum & Non Gems & Jewellery exports
29.97
25.57
Non-petroleum & Non Gems & Jewellery imports
33.15
31.52
Note: Gems & Jewellery Imports include Gold, Silver & Pearls, precious & Semi-precious stones
Fig 5: Trade excluding Petroleum and Gems & Jewellery during February 2024
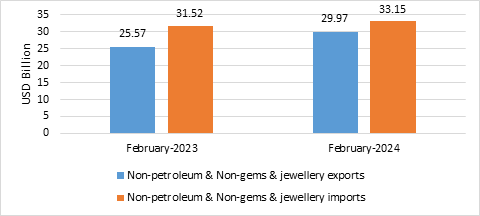
Table 4: Trade excluding Petroleum and Gems & Jewellery during April-February 2023-24
April-February 2023-24
(USD Billion)
April-February 2022-23
(USD Billion)
Non- petroleum exports
316.60
319.99
Non- petroleum imports
457.57
463.65
Non-petroleum & Non Gems & Jewellery exports
286.51
284.78
Non-petroleum & Non Gems & Jewellery imports
387.60
399.03
Note: Gems & Jewellery Imports include Gold, Silver & Pearls, precious & Semi-precious stones
Fig 6: Trade excluding Petroleum and Gems & Jewellery during April-February 2023-24
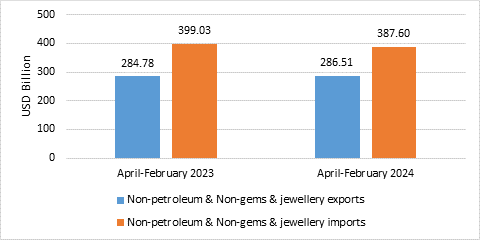
Fig 7: Services Trade during February 2024*
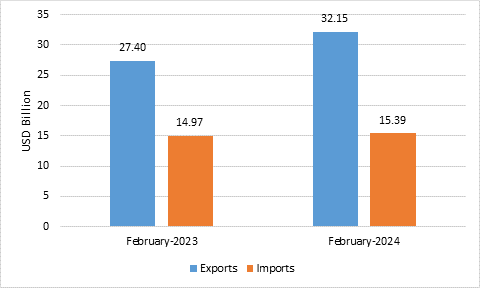
Fig 8: Services Trade during April-February 2023-24*