FIRST PRESS RELEASE OF CONSUMER PRICE INDEX ON BASE 2024=100
FIRST PRESS RELEASE OF CONSUMER PRICE INDEX ON BASE 2024=100
What’s New
Base revised from 2012 to 2024 using Household Consumption Expenditure Survey 2023-24
12 Divisions in place of 6 Groups in accordance to Classification of Individual Consumption According to Purpose (COICOP) 2018
Release of All India and State level Item indices for rural, urban and combined sectors
New Additions: Rural housing, Online media service provider/Streaming services, value added dairy products, Barley & its product, Pen-drive & External Hard disk, Attendant, Babysitter and Exercise equipment
Items Removed: VCR/VCD/DVD player and hiring charges, Radio, Tape recorder, Clothing second-hand, CD/DVD audio/video cassettes and Coir/rope
The Ministry of Statistics & Programme Implementation is releasing the Consumer Price Index (CPI) with Base 2024=100. The item basket and the corresponding weights are based on Household Consumption Expenditure Survey 2023-24. The exercise is being done for enhancing the coverage and representativeness of the inflation measure. The revision introduces more granular data enabling policymakers, financial institutions, businesses and citizens with precise data-driven decisions.
January, 2026 (Provisional) at Base year 2024=100
Rural
Urban
Combined
Inflation (%)
CPI (General)
2.73
2.77
2.75
CFPI
1.96
2.44
2.13
Index
CPI (General)
104.59
104.30
104.46
CFPI
103.89
104.31
104.04
Month
CPI
CFPI
Jan-25
101.67
101.87
Feb-25
101.32
100.40
Mar-25
101.39
100.27
Apr-25
101.58
100.18
May-25
101.90
100.54
Jun-25
102.51
101.74
Jul-25
103.35
103.67
Aug-25
103.74
104.49
Sep-25
103.74
104.12
Oct-25
103.74
103.94
Nov-25
104.01
104.45
Dec-25
104.10
104.09
Jan-26
104.46
104.04
S.No.
Item
Weight
Inflation (%)
1
Garlic

0.3738
-53.05
2
Onion

0.7006
-29.27
3
Potato

0.7549
-28.98
4
Arhar, Tur

0.5333
-24.90
5
Peas

0.1254
-15.56
S.No.
Item
Weight
Inflation (%)
1
Silver Jewellery

0.3127
159.67
2
Tomato

0.4961
64.80
3
Coconut: copra

0.0854
47.18
4
Gold/Diamond/Platinum Jewellery

0.6230
46.77
5
Coconut oil

0.0579
40.44
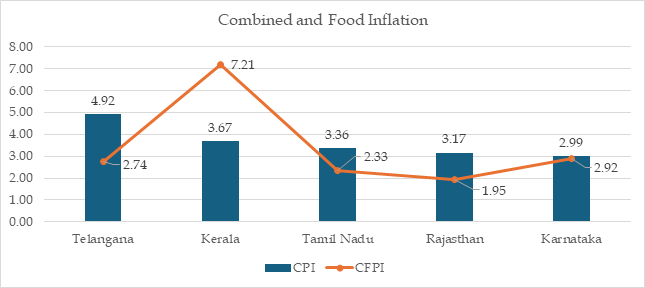
Top five States (having more than 50 lakhs population as per Census 2011) with highest inflation in January, 2026 are given below-
All India CPI, CFPI and corresponding inflation rates for the month of December 2025 (Final) with base year 2012 are given as follows-
December, 2025 (Final) at Base 2012=100
Rural
Urban
Combined
Inflation (%)
CPI (General)
0.76
2.03
1.33
CFPI
-3.03
-2.09
-2.71
Index
CPI (General)
199.9
195.9
198.0
CFPI
198.5
205.9
201.1
Response Rate– Real time price data are collected from selected 1407 urban Markets (including online markets) and 1465 villages covering all States/UTs through personal visits by field staff of Field Operations Division of NSO, MoSPI on a weekly roster. During the month of January, 2026, prices were collected from 100% rural and urban markets while the market-wise prices reported therein were 100% for rural markets and 99.98% for urban markets.
CPI for February 2026 will be released on 12th March, 2026 (Thursday) or the next working day in case of 12th being a holiday.
Detailed indices including granular level indices (State and Item wise) for the year 2025 and January 2026 may be downloaded from eSankhyiki portal of MoSPI- https://esankhyiki.mospi.gov.in/
State-level item indices, available on the portal, should be interpreted cautiously in view of thin samples of price used for index compilation in some of the cases.
IV. Technical Note on Base Updation Exercise of Consumer Price Index (CPI) (Base 2024=100)
Background and Rationale
The Consumer Price Index (CPI) series with base year 2024=100 has been introduced to ensure that the index remains representative of current household consumption patterns, price structures, and the evolving nature of the Indian economy. The previous CPI series with base 2012=100 served as a stable and reliable measure for more than a decade; however, during this period, significant structural changes have occurred in consumption behaviour, income levels, urbanisation, expansion of the services sector, and digitalisation.
The base updation exercise has been undertaken on the basis of the latest Household Consumption Expenditure Survey (HCES) 2023–24, which provides comprehensive information on household expenditure patterns across rural and urban areas of the country.
Expert Group and Consultative Process
An Expert Group on Base Revision of CPI was constituted with representation from the Reserve Bank of India, academia, line Ministries, and statistical experts.
The Expert Group examined methodological, coverage, classification and data-related aspects of CPI revision. In addition, extensive consultations were undertaken through pre-consultative workshops, interactions with key stakeholders and public discussion papers. To understand the global best practices for refining methodology and incorporating alternative data sources, consultations with International Monetary Fund, World Bank and UNECE’s Group of Experts have also been done.
Reference Period and Base Year Selection
For any price index to be robust and analytically sound, the price reference period should be as close as possible to the weight reference period. In CPI 2024, expenditure weights are derived from HCES 2023–24, while base-period prices were collected during January 2024 to December 2024.
Accordingly, 2024 has been selected as the base year, ensuring close alignment between the weight reference period and the price reference period, thereby improving internal consistency and representativeness.
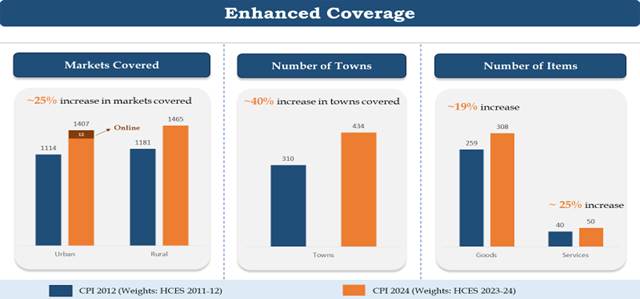
Revision of Item Basket and Coverage
At the all-India level, the number of weighted items has increased from 299 to 358 in CPI 2024. Within this:
This expansion strengthens the representation of the services sector, which has assumed greater importance in household expenditure over time.
Key enhancements:
Adoption of International COICOP – 2018 Framework
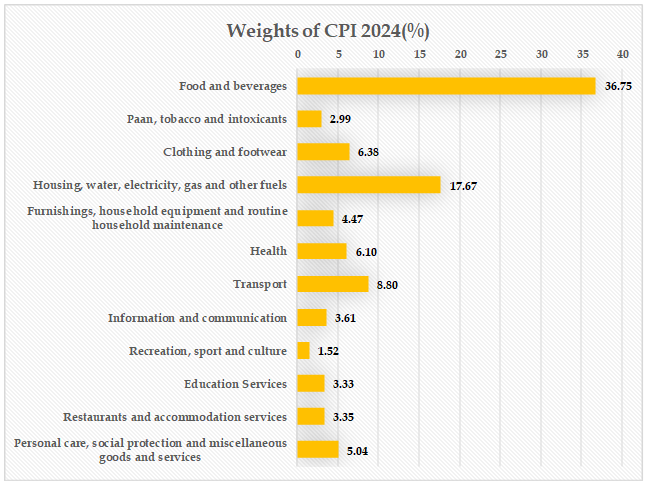
The CPI 2024 series adopts the Classification of Individual Consumption According to Purpose (COICOP) 2018, replacing the earlier structure comprising six broad groups. This is the latest classification system developed by United Nations Statistics Division. Under the revised framework, expenditure is classified into 12 divisions at the first level, 43 groups, 92 classes, 162 subclasses enabling and 358 items at last level of hierarchy which enables:
Revised Weights and Weighing Diagram
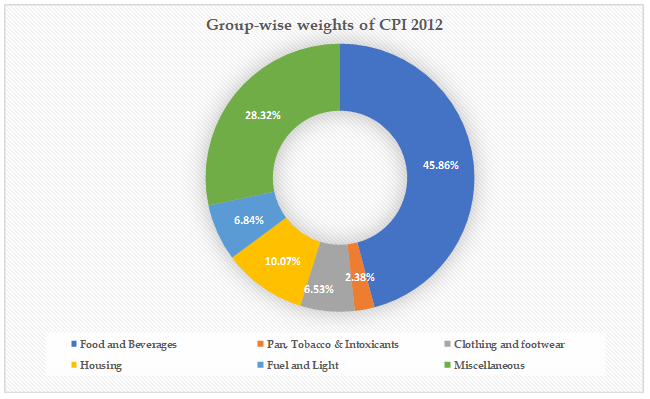
The revised weights reflect updated household expenditure patterns as captured in HCES 2023–24. Share of Food & Beverages is declined in the new series, however, it continues to remain the largest component of the CPI basket.
A diagrammatic presentation of the revised weighing structure, showing division-wise shares for CPI 2012 (Base 2012=100) and CPI 2024 (Base 2024=100), is provided to illustrate changes in relative importance across major consumption groups. The revised weighing diagram highlights:
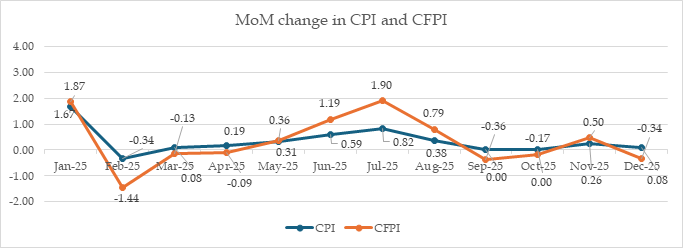
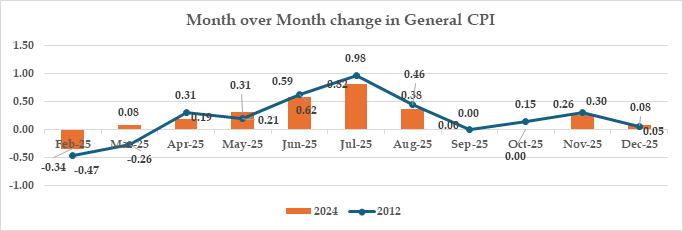
Month-over-Month change in General CPI during 2025 with 2012 as base year vis-à-vis with 2024 as base year
Price Collection Methodology and Digitalisation
As part of the base updation exercise, the CPI 2024 series marks the introduction of Computer Assisted Personal Interviewing (CAPI) for price data collection. Under CAPI, price data are collected electronically using handheld devices with in-built validation checks, standardized item specifications, and real-time monitoring capabilities. The transition to CAPI enhances data quality, timeliness and consistency.
Physical market price collection continues to form the backbone of CPI compilation. However, to reflect changing purchasing behaviour, the CPI 2024 series supplement traditional collection with alternative data sources:
Clear item specifications and defined price collection protocols are followed to ensure comparability and consistency.
Housing Index Compilation
In the revised CPI series, the Housing index is compiled using a weighted average of three constituent groups, namely “actual rental payments for housing”, “maintenance, repair and security of the dwelling”, and “water supply and other miscellaneous services” relating to the dwelling. Housing inflation is thereafter computed on a year-on-year basis based on the resulting composite Housing index.
Compilation of combined index
Combined indices at all levels have been calculated by taking the weighted average of rural and urban indices with corresponding rural and urban weights.
Linking Factor and Back Series
To facilitate continuity and ease of analysis on the basis of time series data, CPI 2024 series is being released along with following back series data;
Calculation of linking factor: A linking factor is calculated to connect the two series over a common overlapping period. The overlapping period here is 2025, during which both CPI 2012 and CPI 2024 indices are available. This overlapping year forms the basis for linking the two series.
Formula for CPI Linking Factor (Annual Overlapping) is as follows:
Let Avg Iynew : denote the annual average (Geometric mean) CPI of the new series for the overlapping year y;
Avg Iyold : denote the annual average (Geometric mean) CPI of the old series for the same overlapping year y.
The Linking Factor (LF) is given by:
LF = Avg Iynew / Avg Iyold
The linked CPI for the earlier month t is obtained as:
Itlinked = ItOld × LF (where month t implies earlier period than y)
ItOld is the CPI for month t from the CPI 2012 series and Itlinked is the corresponding CPI for month t with base 2024. y denotes year 2025.
Following linking factor is used to calculated back series at general level;
S. no.
CPI General
Linking factor
1.
Rural
0.5222
2.
Urban
0.5320
3.
Combined
0.5267
The CPI 2024 series is based on the latest Classification of Individual Consumption According to Purpose (COICOP-2018) framework of UNSD, whereas the CPI 2012 series followed a different classification system. Due to these differences, the two series can be directly linked only for general index level.
Conclusion
The CPI 2024 series represent a comprehensive strengthening of India’s inflation measurement framework. Through updated weights, expanded coverage, improved classification, and incorporation of modern data sources, the revised CPI provides a more representative, transparent and methodologically robust measure of retail price change, aligned with international best practices and current consumption realities.
V. Annexures
Annexure
Title
I
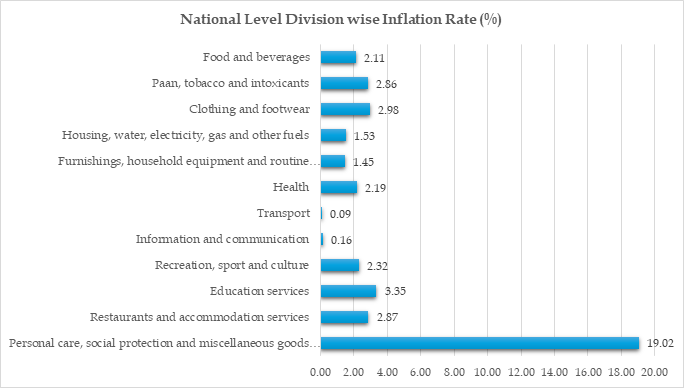
All India General (Rural, Urban and Combined) division wise indices and inflation for January, 2026 (Provisional)
II
All India General (Rural, Urban and Combined) group wise indices and inflation for January, 2026 (Provisional)
III
State wise general index and inflation in January, 2026 (Provisional)
IV
State level (Rural, Urban and Combined) index from January 2025 to December, 2025(downloadable table)
V
Frequently Asked Questions on CPI 2024
Annexure- I
All India General (Rural, Urban and Combined) division wise indices and inflation for January, 2026 (Provisional)
Division code
Division name
Index
Inflation
Rural
Urban
Comb.
Rural
Urban
Comb.
01
Food and beverages
103.89
104.25
104.03
1.96
2.38
2.11
02
Paan, tobacco and intoxicants
104.41
104.42
104.42
2.73
3.15
2.86
03
Clothing and footwear
106.61
104.80
105.92
3.40
2.29
2.98
04
Housing, water, electricity, gas and other fuels
102.11
101.96
102.02
1.33
1.65
1.53
05
Furnishings, household equipment and routine household maintenance
103.12
102.78
102.97
1.55
1.31
1.45
06
Health
103.72
104.22
103.91
2.12
2.30
2.19
07
Transport
100.67
100.61
100.64
0.12
0.06
0.09
08
Information and communication
103.54
102.99
103.30
0.23
0.07
0.16
09
Recreation, sport and culture
103.85
104.22
104.03
2.06
2.58
2.32
10
Education services
104.77
105.71
105.33
3.08
3.53
3.35
11
Restaurants and accommodation services
104.77
106.56
105.71
1.98
3.66
2.87
13
Personal care, social protection and miscellaneous goods and services
123.07
122.05
122.63
19.59
18.28
19.02
All India
104.59
104.30
104.46
2.73
2.77
2.75
Annexure- II
All India General (Rural, Urban and Combined) group wise indices and inflation for January, 2026 (provisional)
Group code
Group name
Index
Inflation
Rural
Urban
Comb.
Rural
Urban
Comb.
01.1
Food
103.89
104.31
104.04
1.96
2.44
2.13
01.2
Beverages
103.65
103.10
103.41
1.71
1.37
1.56
01.3
Services for processing primary goods for food
106.00
106.72
106.21
3.22
3.91
3.42
02.1
Alcoholic beverages
105.81
105.31
105.65
3.78
3.89
3.82
02.3
Paan and tobacco
103.17
103.49
103.26
1.78
2.38
1.96
03.1
Clothing
107.05
105.40
106.42
3.75
2.82
3.40
03.2
Footwear
103.71
101.06
102.67
1.05
-1.04
0.23
04.1
Actual rental payments made for housing
102.62
102.28
102.36
2.18
1.86
1.93
04.3
Maintenance, repair and security of the dwelling
105.13
104.63
104.95
3.23
3.15
3.20
04.4
Water supply and miscellaneous services relating to the dwelling
100.91
102.22
101.82
0.63
1.77
1.42
04.5
Electricity, gas and other fuels
101.06
100.10
100.68
0.26
0.49
0.35
05.1
Furniture, furnishings, and loose carpets
104.58
103.90
104.32
2.28
1.90
2.13
05.2
Household textiles
106.15
103.72
105.24
3.16
1.18
2.41
05.3
Household appliances
101.17
100.18
100.71
0.18
-0.65
-0.21
05.4
Glassware, tableware and household utensils
105.74
104.53
105.28
3.19
2.12
2.78
05.5
Tools and equipment for house and garden
98.85
99.59
99.10
-1.51
-0.54
-1.19
05.6
Goods and services for routine household maintenance
102.68
103.25
102.94
1.46
1.89
1.66
06.1
Medicines and health products
104.40
104.38
104.39
2.52
2.15
2.38
06.2
Outpatient care services
101.96
104.03
102.80
0.89
2.57
1.57
06.3
Inpatient care services
103.95
104.83
104.32
2.76
3.40
3.02
06.4
Other health services
102.23
103.00
102.52
1.16
1.81
1.41
07.1
Purchase of vehicles
97.34
96.65
96.99
-4.32
-4.73
-4.53
07.2
Operation of personal transport equipment
100.03
100.05
100.04
0.11
0.12
0.11
07.3
Passenger transport services
103.15
103.96
103.50
1.88
2.56
2.17
07.4
Transport services for goods
107.51
107.67
107.61
7.34
7.57
7.48
08.1
Information and communication equipment
97.72
97.16
97.46
-2.18
-2.46
-2.31
08.3
Information and communication services
105.11
104.71
104.93
0.84
0.79
0.82
09.1
Recreational durables
97.97
101.25
100.27
-1.15
1.27
0.55
09.2
Other recreational goods
104.71
104.81
104.75
2.63
2.62
2.63
09.3
Garden products and pets
113.77
115.26
114.56
6.62
10.25
8.54
09.4
Recreational services
102.60
101.94
102.20
1.81
1.03
1.34
09.5
Cultural goods
102.09
103.67
102.87
0.68
1.62
1.15
09.6
Cultural services
103.22
104.42
103.96
2.11
2.41
2.29
09.7
Newspapers, books and stationery
102.43
102.54
102.48
1.20
1.49
1.33
10.1
Early childhood and primary education
106.11
105.98
106.03
3.81
3.23
3.45
10.2
Secondary education
105.54
106.99
106.47
3.81
4.33
4.14
10.4
Higher education
102.20
105.74
104.49
1.50
4.72
3.59
10.5
Education not defined by level
103.19
103.21
103.20
2.09
2.20
2.14
11.1
Food and beverage serving services
104.78
106.56
105.73
1.98
3.66
2.87
11.2
Accommodation services
102.07
104.62
103.21
0.87
3.01
1.83
13.1
Personal care
104.61
105.18
104.85
2.91
3.18
3.03
13.2
Other personal effects
172.80
165.27
169.46
62.46
55.17
59.23
13.9
Other services
102.26
101.91
102.12
1.20
1.21
1.20
Annexure-III
State wise general index and inflation in January, 2026 (Provisional)
State
CPI
Inflation
Rural
Urban
Combined
Rural
Urban
Combined
Andaman And Nicobar Islands
108.02
105.70
106.88
5.55
2.94
4.27
Andhra Pradesh
104.10
104.43
104.23
2.58
3.23
2.83
Arunachal Pradesh
102.66
102.94
102.73
1.32
1.22
1.29
Assam
103.08
102.47
102.95
0.67
1.22
0.78
Bihar
104.37
102.40
104.09
2.69
1.25
2.48
Chandigarh
*
103.70
103.70
*
2.33
2.33
Chhattisgarh
103.12
102.46
102.89
2.01
1.01
1.67
Goa
103.44
103.58
103.53
1.56
2.12
1.92
Gujarat
103.02
103.48
103.29
2.01
2.38
2.23
Haryana
104.42
104.37
104.40
2.39
2.72
2.55
Himachal Pradesh
104.73
105.01
104.77
2.86
3.24
2.92
Jammu And Kashmir
104.37
103.79
104.21
1.13
1.87
1.34
Jharkhand
104.45
102.57
103.81
2.42
1.23
2.02
Karnataka
105.32
104.87
105.09
2.97
3.02
2.99
Kerala
106.50
105.02
105.68
4.18
3.26
3.67
Ladakh
105.30
104.51
105.10
1.92
1.29
1.76
Lakshadweep
104.27
105.33
105.04
2.28
3.30
3.02
Madhya Pradesh
104.20
104.09
104.15
2.58
2.94
2.72
Maharashtra
104.57
104.07
104.27
2.84
2.45
2.60
Manipur
101.78
103.38
102.30
-0.43
1.29
0.12
Meghalaya
104.55
103.30
104.23
1.75
1.43
1.66
Mizoram
103.10
102.09
102.52
0.53
0.04
0.25
Nagaland
105.39
103.45
104.65
2.66
1.87
2.36
NCT of Delhi
101.70
103.04
103.01
1.86
2.15
2.15
Odisha
103.76
103.09
103.58
1.88
1.84
1.87
Puducherry
105.18
105.32
105.28
2.60
3.75
3.39
Punjab
105.07
103.93
104.55
3.04
2.32
2.71
Rajasthan
104.97
104.61
104.84
3.29
2.95
3.17
Sikkim
105.44
105.25
105.38
2.92
3.25
3.04
Tamil Nadu
105.54
105.61
105.58
3.16
3.51
3.36
Telangana
106.91
106.36
106.59
5.19
4.72
4.92
The Dadra And Nagar Haveli And Daman And Diu
103.15
104.23
103.96
2.00
2.78
2.58
Tripura
102.02
102.04
102.03
1.41
0.89
1.29
Uttar Pradesh
104.66
104.28
104.54
2.64
2.74
2.67
Uttarakhand
105.00
103.60
104.49
2.34
1.81
2.15
West Bengal
104.06
103.94
104.00
2.86
2.70
2.79
*: No rural market in Chandigarh
Annexure- V
Frequently Asked Questions (FAQs) on CPI 2024 Series
Ans: The Consumer Price Index (CPI) is designed to measure the changes over time in general level of retail prices of selected goods and services that households purchase for the purpose of consumption.
Ans: Inflation is calculated as the year-on-year percentage change in CPI.
Inflation Rate (%) = It–It-12It-12×100 , where It is the CPI for the month ‘t’. It-12 is the CPI for the t month of the previous year.
Ans: The Base Year is a chosen year taken as a reference point (index = 100) to compare prices over time. It is important because it helps measure how much prices have increased or decreased and keeps inflation figures relevant and easy to understand.
Ans: The base year of the new CPI series is 2024=100.
Ans: The base updation exercise mainly involves revising the CPI item basket and updating item weights based on the latest Household Consumption Expenditure Survey (HCES). This base updation exercise encompasses fresh market survey, base price collection and other methodological refinements.
Ans: The latest Household Consumption Expenditure Survey (HCES) 2023-24 is used for updating item basket and weights of CPI 2024 series.
Ans: CPI 2024 series covers 1,465 rural markets and 1,395 urban markets across 434 towns. In addition, 12 online markets are covered across 12 towns having a population of more than 25 lakh.
Ans: Price data are collected monthly from rural and urban markets. Online prices are collected on weekly basis.
Ans:
Index reference period: It is the period for which index equals 100. For the current CPI, the index reference period is 2024=100.
Weight reference period: It is the period for on the basis of which weights are calculated. For CPI 2024, Household Consumption Expenditure Survey 2023-24 data is used for deriving the weights.
Price reference period: It is the period during which the base prices are collected. The price reference for the current CPI series is calendar year 2024.
Ans: Major changes in CPI 2024 includes revising item baskets and weights as per HCES 2023-24, adoption of COICOP – 2018 Framework, refinement in Index compilation methodology, inclusion of alternative data sources, use of modern technology and more granular data dissemination.
Ans: The Consumer Price Index (Rural, urban and combined) has been started releasing by the Ministry of Statistics and Programme Implementation (MoSPI) since January 2011 with base year 2010=100.
Ans: Weights (All India, State, Sector, Division, Group and Item wise) for CPI 2024 series are available at “www. mospi.gov.in” and https://www.cpi.mospi.gov.in in announcement tab.
Ans: The main role of the Expert Group is to provide guidance and recommendations on the CPI base updation including sample selection and methodology.
Ans: Twelve online markets have been added across 12 towns with a population of more than 25 lakh to capture price variations of items sold on e-commerce and online platforms. In addition, price collection for airfare, telephone and OTT are also collected through online platforms.
Ans: At All-India level, the total weighted items have been increased from 299 to 358. Specifically, goods items have risen from 259 to 308, and services items from 40 to 50.
Ans: Field Operations Division of National Sample Survey (NSS), MoSPI collects monthly price data for CPI.
Ans: In the CPI 2024 series, prices are collected using a tablet-based software application via Computer Assisted Personal Interview (CAPI), replacing the traditional paper-based method.
Ans: The Classification of Individual Consumption According to Purpose (COICOP) is the international classification of household expenditure developed by United Nations Statistics Division. The objective of the COICOP is to provide a framework of homogeneous categories of goods and services from the point of view of its usage by the households. Its adoption ensures that India’s CPI is comparable with CPIs worldwide.
Ans: CPI 2024 has 12 Divisions, 43 Groups, 92 Classes, and 162 Sub-classes as per COICOP 2018.
Ans: The Jevons index (Short index formula) is used for compiling elementary indices in the CPI 2024 series.
Ans: The Young/Modified Laspeyres’ index is used for compiling higher level indices in the CPI 2024 series.
Ans: Total 19039 dwellings, including 15715 in urban and 3324 in rural, are identified for rent collection in CPI 2024. In view of use of chain-based index, more dwellings, if available, may be added in future.
Ans: Yes
Ans: The weight of rural housing in CPI 2024 series is 11.764%. This includes Housing, water, electricity, gas and other fuels. However, House rent share for rural sector is 2.4572.
Ans: By definition, CPI should include only items on which households actually spend money. IMF’s manual on CPI also suggests that social transfer in kind should not be considered in CPI compilation. In view of this, free social transfers are excluded from CPI.
Ans: In the CPI 2024 series, alternative data sources such as administrative data and e-commerce/online price data are used.
Ans: Airfares are collected through well-known online platforms.
Ans: Prices for services like Amazon Prime Video, Netflix, Jio Hotstar, SonyLiv, YouTube Premium, and Zee5 are collected online directly from the service providers’ websites.
Ans: Yes. Two plans for both pre-paid and post-paid are included for compilation of telephone charges(mobile) index. Administrative data on subscriber shares is taken from the report of TRAI.
Ans: Postage and money order charges are collected from administrative data provided by the Department of Posts.
Ans: Rail fares are collected using administrative data from the Ministry of Railways.
Ans: Retail selling prices (RSP) of fuel items are collected from the Petroleum Planning and Analysis Cell (PPAC), Ministry of Petroleum & Natural Gas.
Ans: All India General, combined, rural, urban wise indices for Divisions, Groups, Classes, Sub-classes and items will be released every month.
Ans: State level General, combined, rural, urban wise indices for Divisions, Groups, Classes, Sub-classes and items will be released every month for all States/UTs.
Ans: CPI 2024 data can be accessed from the e-Sankhyiki portal (MoSPI) at: https://esankhyiki.mospi.gov.in/macroindicators?product=cpi
Ans: The back series will be calculated on the basis of linking factor. Following Back Series for Base 2024=100 will be published on 12th February, 2026;
Ans: The linking factor is calculated to connect the two series over a common overlapping period. The overlapping period here is 2025, during which both CPI 2012 and CPI 2024 indices are available. This overlapping year forms the basis for linking the two series.
Formula for CPI Linking Factor (Annual Overlapping) is as follows:
Let Avg Iynew : denote the annual average (Geometric Mean) CPI of the new series for the overlapping year y;
Avg Iyold : denote the annual average (Geometric Mean) CPI of the old series for the same overlapping year y.
The Linking Factor (LF) is given by:
LF = Avg Iynew / Avg Iyold
The linked CPI for the earlier month t is obtained as:
Itlinked = ItOld × LF (where month t implies earlier period than y)
ItOld is the CPI for month t from the CPI 2012 series and Itlinked is the corresponding CPI for month t with base 2024. “y” denotes year 2025.
Ans: Following linking factor is used to calculate back series at general level;
S. no.
CPI General Level
Linking factor
Rural
0.5222
Urban
0.5320
Combined
0.5267
Ans: Group-wise weights as per CPI 2012 structure are given in table below:
Group
Rural
Urban
Combined
2012
2024
2012
2024
2012
2024
Food and Beverages
54.180
44.801
36.287
34.264
45.863
40.104
Pan, Tobacco &Intoxicants
3.263
3.733
1.363
2.065
2.380
2.989
Clothing and footwear
7.357
7.123
5.571
5.464
6.527
6.383
Housing
NA
5.527
21.664
19.778
10.070
11.881
Fuel and Light
7.940
5.957
5.580
4.907
6.843
5.489
Miscellaneous
27.260
32.858
29.535
33.523
28.317
33.154
Division-wise weights as per new (2024) structure are given in table below:
Divisions
Rural
Urban
Combined
CPI 2012
CPI 2024
CPI 2012
CPI 2024
CPI 2012
CPI 2024
Food and beverages
50.922
41.983
32.811
30.251
42.617
36.753
Paan, tobacco and intoxicants
3.263
3.733
1.363
2.065
2.380
2.989
Clothing and footwear
7.357
7.123
5.571
5.464
6.527
6.383
Housing, water, electricity, gas and other fuels
7.983
11.764
27.294
25.000
16.888
17.665
Furnishings, household equipment and routine household maintenance
3.632
4.609
3.701
4.296
3.656
4.469
Health
6.839
6.764
4.820
5.275
5.900
6.100
Transport
5.645
8.644
7.129
8.985
6.394
8.796
Information and communication
2.818
3.647
3.906
3.563
3.323
3.609
Recreation, sport and culture
1.463
1.359
1.634
1.710
1.547
1.516
Education Services
2.468
2.383
4.720
4.515
3.513
3.333
Restaurants and accommodation services
3.248
2.841
3.489
3.978
3.246
3.348
Personal care, social protection and miscellaneous goods and services
4.362
5.150
3.566
4.899
4.006
5.038
Ans: If the CPI 2012 classification system were followed, the share of Food and Beverages would have declined from 45.86% to 40.10%. As per the CPI 2024 classification structure, the share of Food and Beverages, which currently stands at 36.75% for 2024 series, would have been around 42.62% for the 2012 series. The change in structure between both the series is due to adoption of Classification of Individual Consumption According to Purpose (COICOP) 2018 Framework of United Nations Statistics Division (UNSD).
Ans: The weight of education services in CPI 2024 is 3.3%. Under COICOP 2018, books and stationery are classified separately from education services. When education services are combined with books and stationery, the effective “Education” share in CPI 2024 is 4.0%, compared with 4.46% in CPI 2012.
Ans: The Ministry plans to institutionalize base revisions at regular intervals. As per global practices, it should be done every three to five years, depending on the availability of Household Consumption Expenditure Survey (HCES) data.
- Key Statistics
- National Level Indices
-
- Year-on-year inflation rate based on All India Consumer Price Index (CPI) with base year 2024 for the month of January, 2026 over January, 2025 is 2.75%(Provisional). Corresponding inflation rates for rural and urban are 2.73% and 2.77%, respectively.