Despite persistent global challenges, overall exports (merchandise + services) estimated to surpass last year’s highest record. It is estimated to reach USD 776.68 Billion in FY 2023-24 as compared to USD 776.40 Billion in FY 2022-23.
Despite persistent global challenges, overall exports (merchandise + services) estimated to surpass last year’s highest record. It is estimated to reach USD 776.68 Billion in FY 2023-24 as compared to USD 776.40 Billion in FY 2022-23.
March 2024
Table 1: Trade during March 2024*
March 2024
(USD Billion)
March 2023
(USD Billion)
Merchandise
Exports
41.68
41.96
Imports
57.28
60.92
Services*
Exports
28.54
30.44
Imports
15.84
16.96
Overall Trade
(Merchandise +Services) *
Exports
70.21
72.40
Imports
73.12
77.88
Trade Balance
-2.91
-5.48
* Note: The latest data for services sector released by RBI is for February 2024. The data for March 2024 is an estimation, which will be revised based on RBI’s subsequent release. (ii) Data for FY 2022-23 (April-March) and April-December 2023 has been revised on pro-rata basis using quarterly balance of payments data.
Fig 1: Overall Trade during March 2024*
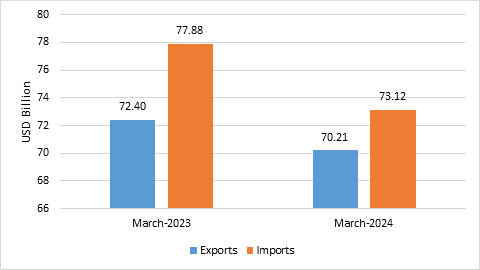
Table 2: Trade during FY 2023-24 (April-March)*
2023-24
(USD Billion)
2022-23
(USD Billion)
Merchandise
Exports
437.06
451.07
Imports
677.24
715.97
Services*
Exports
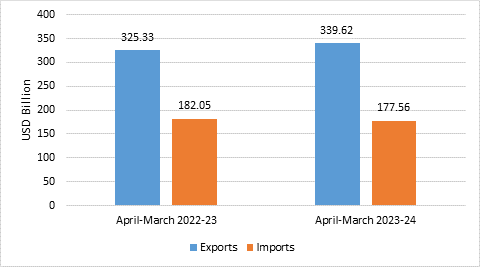
339.62
325.33
Imports
177.56
182.05
Overall Trade
(Merchandise+ Services)*
Exports
776.68
776.40
Imports
854.80
898.01
Trade Balance
-78.12
-121.62
Fig 2: Overall Trade during FY 2023-24 (April-March)*
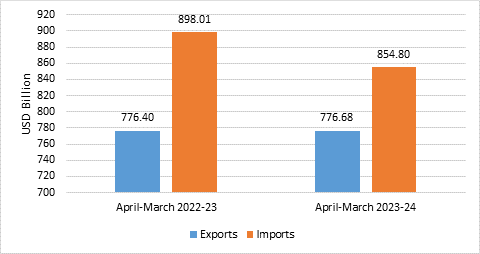
Fig 3: Merchandise Trade during March 2024
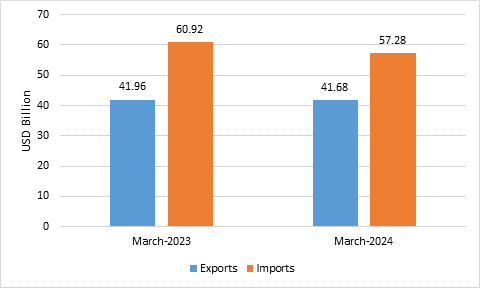
Fig 4: Merchandise Trade during FY 2023-24 (April-March)
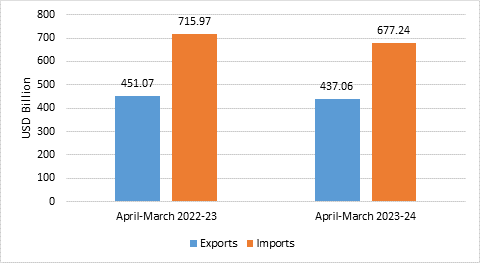
Table 3: Trade excluding Petroleum and Gems & Jewellery during March 2024
(USD Billion)
March 2023
(USD Billion)
Non- petroleum exports
36.29
33.61
Non- petroleum imports
40.05
42.90
Non-petroleum & Non Gems & Jewellery exports
33.67
30.87
Non-petroleum & Non Gems & Jewellery imports
35.21
36.51
Note: Gems & Jewellery Imports include Gold, Silver & Pearls, precious & Semi-precious stones
Fig 5: Trade excluding Petroleum and Gems & Jewellery during March 2024
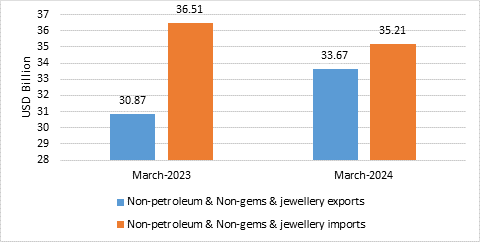
Table 4: Trade excluding Petroleum and Gems & Jewellery during FY 2023-24 (April-March)
2023-24
(USD Billion)
2022-23
(USD Billion)
Non- petroleum exports
352.92
353.60
Non- petroleum imports
497.62
506.55
Non-petroleum & Non Gems & Jewellery exports
320.21
315.64
Non-petroleum & Non Gems & Jewellery imports
422.80
435.54
Note: Gems & Jewellery Imports include Gold, Silver & Pearls, precious & Semi-precious stones
Fig 6: Trade excluding Petroleum and Gems & Jewellery during FY 2023-24 (April-March)
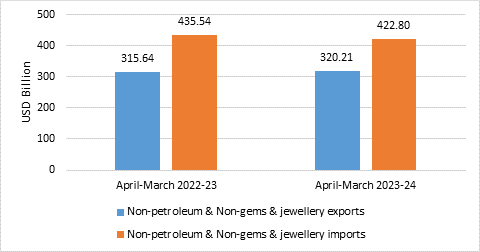
Fig 7: Services Trade during March 2024*
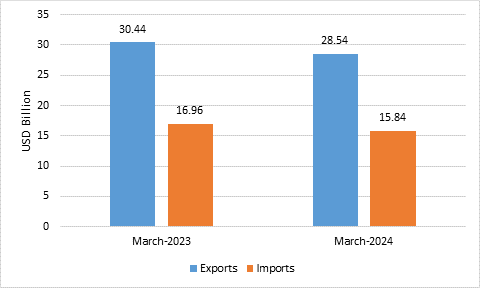
Fig 8: Services Trade during FY 2023-24 (April-March)*