CONSUMER PRICE INDEX NUMBERS ON BASE 2012=100 FOR RURAL, URBAN AND COMBINED FOR THE MONTH OF NOVEMBER 2024
CONSUMER PRICE INDEX NUMBERS ON BASE 2012=100 FOR RURAL, URBAN AND COMBINED FOR THE MONTH OF NOVEMBER 2024
I. Key highlights:
November 2024 over November 2023), based on General Indices and CFPIs are given as follows:
All India year-on-year inflation rates (%) based on CPI (General) and CFPI: November 2024 over
November 2023
November 2024 (Prov.)
October 2024 (Final)
November 2023
Rural
Urban
Combd.
Rural
Urban
Combd.
Rural
Urban
Combd.
Inflation
CPI (General)
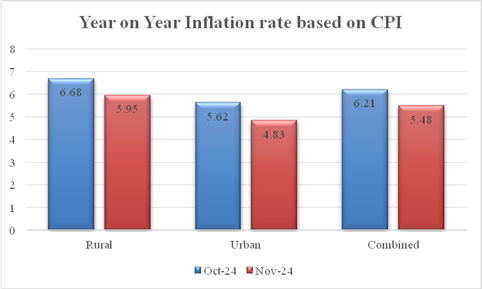
5.95
4.83
5.48
6.68
5.62
6.21
5.85
5.26
5.55
CFPI
9.10
8.74
9.04
10.69
11.09
10.87
8.38
9.33
8.70
Index
CPI (General)
199.4
193.1
196.5
199.5
193.7
196.8
188.2
184.2
186.3
CFPI
207.4
214.0
209.8
208.2
216.3
211.1
190.1
196.8
192.4
Notes: Prov. – Provisional, Combd. – Combined
Monthly changes (%) in All India CPI (General) and CFPI: November 2024 over October 2024
Indices
November 2024 (Prov.)
October 2024 (Final)
Monthly change (%)
Rural
Urban
Combd.
Rural
Urban
Combd.
Rural
Urban
Combd.
CPI (General)
199.4
193.1
196.5
199.5
193.7
196.8
-0.05
-0.31
-0.15
CFPI
207.4
214.0
209.8
208.2
216.3
211.1
-0.38
-1.06
-0.62
Note: Figures of November 2024 are provisional.
List of Annex
Annex
Title
I
All-India General, Group and Sub-group level CPI and CFPI numbers for October 2024 (Final) and November 2024 (Provisional) for Rural, Urban and Combined (Annexure I)
II
All-India inflation rates (%) for General, Group and Sub-group level CPI and CFPI numbers for November 2024 (Provisional) for Rural, Urban and Combined
(Annexure II)
III
General CPI for States for Rural, Urban and Combined for October 2024 (Final) and November 2024 (Provisional) (Annexure III)
IV
Year-on-year inflation rates (%) of major States for Rural, Urban and Combined for November 2024 (Provisional) (Annexure IV)
V
Time Series Data for All India General CPI (Base 2012 =100) Since January 2013 (Annexure V)
VI
Annex I
All-India General, Group and Sub-group level CPI and CFPI numbers for October 2024 (Final) and November 2024 (Provisional) for Rural, Urban and Combined
(Base: 2012=100)
Group Code
Sub-group Code
Description
Rural
Urban
Combined
Weights
Oct 24 Index
(Final)
Nov. 24 Index
(Prov.)
Weights
Oct 24 Index
(Final)
Nov. 24 Index
(Prov.)
Weights
Oct 24 Index
(Final)
Nov. 24 Index
(Prov.)
(1)
(2)
(3)
(4)
(5)
(6)
(7)
(8)
(9)
(10)
(11)
(12)
1.1.01
Cereals and products
12.35
196.3
198.1
6.59
194.1
195.5
9.67
195.6
197.3
1.1.02
Meat and fish
4.38
221.6
220.9
2.73
230.5
229.8
3.61
224.7
224.0
1.1.03
Egg
0.49
194.1
199.3
0.36
199.0
204.7
0.43
196.0
201.4
1.1.04
Milk and products
7.72
186.9
187.2
5.33
187.9
187.8
6.61
187.3
187.4
1.1.05
Oils and fats
4.21
181.0
186.8
2.81
168.2
172.8
3.56
176.3
181.7
1.1.06
Fruits
2.88
192.5
190.7
2.90
196.1
193.8
2.89
194.2
192.1
1.1.07
Vegetables
7.46
270.5
259.9
4.41
333.9
315.2
6.04
292.0
278.7
1.1.08
Pulses and products
2.95
215.0
214.5
1.73
220.1
219.4
2.38
216.7
216.2
1.1.09
Sugar and Confectionery
1.70
131.3
131.1
0.97
133.0
133.2
1.36
131.9
131.8
1.1.10
Spices
3.11
229.7
230.0
1.79
225.0
224.3
2.50
228.1
228.1
1.2.11
Non-alcoholic beverages
1.37
185.4
186.0
1.13
174.0
174.8
1.26
180.6
181.3
1.1.12
Prepared meals, snacks, sweets etc.
5.56
199.6
200.5
5.54
210.2
210.8
5.55
204.5
205.3
1
Food and beverages
54.18
206.7
206.2
36.29
214.1
212.3
45.86
209.4
208.4
2
Pan, tobacco and intoxicants
3.26
207.4
208.1
1.36
213.5
212.2
2.38
209.0
209.2
3.1.01
Clothing
6.32
199.2
200.0
4.72
189.2
189.6
5.58
195.3
195.9
3.1.02
Footwear
1.04
192.9
193.4
0.85
175.2
175.4
0.95
185.5
185.9
3
Clothing and footwear
7.36
198.3
199.0
5.57
187.1
187.4
6.53
193.9
194.4
4
Housing
–
–
–
21.67
182.7
183.0
10.07
182.7
183.0
5
Fuel and light
7.94
181.1
180.8
5.58
169.7
169.6
6.84
176.8
176.6
6.1.01
Household goods and services
3.75
185.8
186.4
3.87
177.4
178.0
3.80
181.8
182.4
6.1.02
Health
6.83
198.6
199.3
4.81
193.6
194.0
5.89
196.7
197.3
6.1.03
Transport and communication
7.60
176.4
176.6
9.73
165.5
165.6
8.59
170.7
170.8
6.1.04
Recreation and amusement
1.37
180.4
181.0
2.04
176.0
176.4
1.68
177.9
178.4
6.1.05
Education
3.46
191.8
192.0
5.62
187.6
187.8
4.46
189.3
189.5
6.1.06
Personal care and effects
4.25
205.1
206.0
3.47
207.3
207.7
3.89
206.0
206.7
6
Miscellaneous
27.26
189.9
190.4
29.53
181.5
181.8
28.32
185.8
186.2
General Index (All Groups)
100.00
199.5
199.4
100.00
193.7
193.1
100.00
196.8
196.5
Consumer Food Price Index (CFPI)
47.25
208.2
207.4
29.62
216.3
214.0
39.06
211.1
209.8
Notes:
Annex II
All-India year-on-year inflation rates (%) for General, Group and Sub-group level CPI and CFPI numbers for November 2024 (Provisional) for Rural, Urban and Combined
(Base: 2012=100)
Group Code
Sub-group Code
Description
Rural
Urban
Combined
Nov. 23 Index
(Final)
Nov. 24
Index
(Prov.)
Inflation Rate
(%)
Nov. 23 Index
(Final)
Nov. 24
Index
(Prov.)
Inflation Rate
(%)
Nov. 23 Index
(Final)
Nov. 24
Index
(Prov.)
Inflation Rate
(%)
(1)
(2)
(3)
(4)
(5)
(6)
(7)
(8)
(9)
(10)
(11)
(12)
1.1.01
Cereals and products
184.8
198.1
7.20
184.2
195.5
6.13
184.6
197.3
6.88
1.1.02
Meat and fish
210.9
220.9
4.74
219.6
229.8
4.64
214.0
224.0
4.67
1.1.03
Egg
190.4
199.3
4.67
194.8
204.7
5.08
192.1
201.4
4.84
1.1.04
Milk and products
182.2
187.2
2.74
182.3
187.8
3.02
182.2
187.4
2.85
1.1.05
Oils and fats
162.6
186.8
14.88
156.7
172.8
10.27
160.4
181.7
13.28
1.1.06
Fruits
174.6
190.7
9.22
182.7
193.8
6.08
178.4
192.1
7.68
1.1.07
Vegetables
199.9
259.9
30.02
246.0
315.2
28.13
215.5
278.7
29.33
1.1.08
Pulses and products
202.9
214.5
5.72
209.3
219.4
4.83
205.1
216.2
5.41
1.1.09
Sugar and Confectionery
129.7
131.1
1.08
130.9
133.2
1.76
130.1
131.8
1.31
1.1.10
Spices
249.8
230.0
-7.93
239.7
224.3
-6.42
246.4
228.1
-7.43
1.2.11
Non-alcoholic beverages
181.8
186.0
2.31
169.0
174.8
3.43
176.5
181.3
2.72
1.1.12
Prepared meals, snacks, sweets etc.
193.7
200.5
3.51
201.8
210.8
4.46
197.5
205.3
3.95
1
Food and beverages
190.2
206.2
8.41
196.6
212.3
7.99
192.6
208.4
8.20
2
Pan, tobacco and intoxicants
202.9
208.1
2.56
208.5
212.2
1.77
204.4
209.2
2.35
3.1.01
Clothing
194.4
200.0
2.88
184.5
189.6
2.76
190.5
195.9
2.83
3.1.02
Footwear
189.8
193.4
1.90
171.0
175.4
2.57
182.0
185.9
2.14
3
Clothing and footwear
193.7
199.0
2.74
182.4
187.4
2.74
189.2
194.4
2.75
4
Housing
–
–
–
177.9
183.0
2.87
177.9
183.0
2.87
5
Fuel and light
182.4
180.8
-0.88
175.8
169.6
-3.53
179.9
176.6
-1.83
6.1.01
Household goods and services
182.0
186.4
2.42
172.3
178.0
3.31
177.4
182.4
2.82
6.1.02
Health
191.9
199.3
3.86
186.2
194.0
4.19
189.7
197.3
4.01
6.1.03
Transport and communication
171.7
176.6
2.85
161.7
165.6
2.41
166.4
170.8
2.64
6.1.04
Recreation and amusement
176.4
181.0
2.61
171.8
176.4
2.68
173.8
178.4
2.65
6.1.05
Education
185.2
192.0
3.67
180.4
187.8
4.10
182.4
189.5
3.89
6.1.06
Personal care and effects
186.7
206.0
10.34
187.9
207.7
10.54
187.2
206.7
10.42
6
Miscellaneous
182.5
190.4
4.33
174.4
181.8
4.24
178.6
186.2
4.26
General Index (All Groups)
188.2
199.4
5.95
184.2
193.1
4.83
186.3
196.5
5.48
Consumer Food Price Index
190.1
207.4
9.10
196.8
214.0
8.74
192.4
209.8
9.04
Notes:
Annex III
General CPI for States for Rural, Urban and Combined for October 2024 (Final) and November 2024 (Provisional) (Base: 2012=100)
Sl. No.
Name of the State/UT
Rural
Urban
Combined
Weights
Oct24 Index
(Final)
Nov. 24 Index
(Prov.)
Weights
Oct24 Index
(Final)
Nov. 24 Index
(Prov.)
Weights
Oct 24 Index
(Final)
Nov. 24 Index
(Prov.)
(1)
(2)
(3)
(4)
(5)
(6)
(7)
(8)
(9)
(10)
(11)
1
Andhra Pradesh
5.40
201.4
200.7
3.64
201.2
200.7
4.58
201.3
200.7
2
Arunachal Pradesh
0.14
199.5
200.7
0.06
—
—
0.10
199.5
200.7
3
Assam
2.63
200.8
199.6
0.79
196.9
197.7
1.77
200.0
199.2
4
Bihar
8.21
197.4
197.0
1.62
203.6
204.2
5.14
198.3
198.1
5
Chhattisgarh
1.68
194.5
195.4
1.22
188.3
187.6
1.46
192.1
192.4
6
Delhi
0.28
176.7
176.7
5.64
176.2
174.2
2.77
176.2
174.3
7
Goa
0.14
182.7
182.8
0.25
181.0
181.9
0.19
181.7
182.2
8
Gujarat
4.54
194.3
194.2
6.82
186.1
184.9
5.60
189.7
188.9
9
Haryana
3.30
202.6
200.9
3.35
187.8
186.1
3.32
195.7
194.0
10
Himachal Pradesh
1.03
184.1
183.6
0.26
188.5
188.2
0.67
184.9
184.4
11
Jharkhand
1.96
193.4
193.8
1.39
196.9
196.3
1.69
194.7
194.8
12
Karnataka
5.09
200.0
200.2
6.81
201.7
201.5
5.89
200.9
200.9
13
Kerala
5.50
202.3
203.5
3.46
198.3
198.9
4.55
200.9
201.9
14
Madhya Pradesh
4.93
198.2
198.3
3.97
197.7
198.1
4.48
198.0
198.2
15
Maharashtra
8.25
197.3
197.7
18.86
189.2
188.9
13.18
191.9
191.8
16
Manipur
0.23
235.1
239.2
0.12
193.3
195.1
0.18
221.9
225.2
17
Meghalaya
0.28
179.5
179.3
0.15
185.9
185.0
0.22
181.5
181.1
18
Mizoram
0.07
207.5
207.7
0.13
183.0
182.9
0.10
192.5
192.6
19
Nagaland
0.14
201.2
202.0
0.12
185.7
186.9
0.13
194.6
195.6
20
Odisha
2.93
205.2
205.0
1.31
193.1
192.5
2.18
201.8
201.5
21
Punjab
3.31
191.4
191.4
3.09
183.8
183.2
3.21
188.0
187.7
22
Rajasthan
6.63
195.5
194.8
4.23
193.0
192.4
5.51
194.6
193.9
23
Sikkim
0.06
205.7
205.8
0.03
190.8
191.1
0.05
200.8
201.0
24
Tamil Nadu
5.55
202.8
202.8
9.20
201.1
200.7
7.25
201.8
201.6
25
Telangana
3.16
211.1
210.6
4.41
203.8
202.8
3.74
207.1
206.3
26
Tripura
0.35
217.1
217.2
0.14
213.1
211.0
0.25
216.1
215.6
27
Uttar Pradesh
14.83
200.2
200.3
9.54
195.2
194.6
12.37
198.4
198.3
28
Uttarakhand
1.06
190.8
191.1
0.73
196.7
197.1
0.91
193.0
193.3
29
West Bengal
6.99
204.3
203.6
7.20
198.0
197.6
7.09
201.3
200.8
30
Andaman & Nicobar Islands
0.05
201.1
204.2
0.07
187.1
189.0
0.06
194.0
196.5
31
Chandigarh
0.02
195.8
196.8
0.34
182.4
181.8
0.17
183.2
182.7
32
Dadra & Nagar Haveli
0.02
184.8
185.0
0.04
191.3
190.8
0.03
189.1
188.9
33
Daman & Diu
0.02
202.0
203.5
0.02
191.0
191.0
0.02
197.4
198.3
34
Jammu & Kashmir*
1.14
204.9
205.7
0.72
200.2
200.7
0.94
203.2
203.9
35
Lakshadweep
0.01
203.0
199.5
0.01
186.0
188.1
0.01
194.3
193.7
36
Puducherry
0.08
209.7
210.5
0.27
198.8
199.1
0.17
201.6
202.0
All India
100.00
199.5
199.4
100.00
193.7
193.1
100.00
196.8
196.5
Notes:
and Ladakh (erstwhile State of Jammu & Kashmir).
Annex IV
Year-on-year inflation rates (%) of major@ States for Rural, Urban and Combined for November 2024 (Provisional)
(Base: 2012=100)
Sl. No.
Name of the State/UT
Rural
Urban
Combined
Nov. 23 Index
(Final)
Nov. 24
Index
(Prov.)
Inflation Rate
(%)
Nov. 23 Index
(Final)
Nov. 24
Index
(Prov.)
Inflation Rate
(%)
Nov. 23 Index
(Final)
Nov. 24
Index
(Prov.)
Inflation Rate
(%)
(1)
(2)
(3)
(4)
(5)
(6)
(7)
(8)
(9)
(10)
(11)
1
Andhra Pradesh
190.8
200.7
5.19
191.6
200.7
4.75
191.1
200.7
5.02
2
Assam
189.8
199.6
5.16
187.9
197.7
5.22
189.4
199.2
5.17
3
Bihar
183.3
197.0
7.47
189.3
204.2
7.87
184.2
198.1
7.55
4
Chhattisgarh
178.2
195.4
9.65
176.4
187.6
6.35
177.5
192.4
8.39
5
Delhi
170.1
176.7
3.88
169.8
174.2
2.59
169.8
174.3
2.65
6
Gujarat
184.3
194.2
5.37
174.5
184.9
5.96
178.8
188.9
5.65
7
Haryana
189.5
200.9
6.02
178.1
186.1
4.49
184.2
194.0
5.32
8
Himachal Pradesh
174.5
183.6
5.21
179.2
188.2
5.02
175.4
184.4
5.13
9
Jharkhand
184.5
193.8
5.04
185.4
196.3
5.88
184.8
194.8
5.41
10
Karnataka
190.0
200.2
5.37
192.2
201.5
4.84
191.2
200.9
5.07
11
Kerala
190.1
203.5
7.05
189.4
198.9
5.02
189.9
201.9
6.32
12
Madhya Pradesh
185.5
198.3
6.90
189.0
198.1
4.81
186.9
198.2
6.05
13
Maharashtra
189.2
197.7
4.49
179.9
188.9
5.00
183.0
191.8
4.81
14
Odisha
190.8
205.0
7.44
183.2
192.5
5.08
188.7
201.5
6.78
15
Punjab
182.2
191.4
5.05
175.7
183.2
4.27
179.3
187.7
4.68
16
Rajasthan
185.7
194.8
4.90
184.0
192.4
4.57
185.1
193.9
4.75
17
Tamil Nadu
192.9
202.8
5.13
191.4
200.7
4.86
192.0
201.6
5.00
18
Telangana
200.8
210.6
4.88
195.5
202.8
3.73
197.9
206.3
4.24
19
Uttar Pradesh
186.7
200.3
7.28
185.0
194.6
5.19
186.1
198.3
6.56
20
Uttarakhand
181.9
191.1
5.06
186.1
197.1
5.91
183.5
193.3
5.34
21
West Bengal
193.3
203.6
5.33
188.9
197.6
4.61
191.2
200.8
5.02
22
Jammu & Kashmir*
193.9
205.7
6.09
193.6
200.7
3.67
193.8
203.9
5.21
All India
188.2
199.4
5.95
184.2
193.1
4.83
186.3
196.5
5.48
Notes:
Annexure V
Time Series Data for All India General CPI (Base 2012 =100) Since January 2013
Year
Jan
Feb
Mar
Apr
May
Jun
Jul
Aug
Sep
Oct
Nov
Dec
2013
104.6
105.3
105.5
106.1
106.9
109.3
111.0
112.4
113.7
114.8
116.3
114.5
2014
113.6
113.6
114.2
115.1
115.8
116.7
119.2
120.3
120.1
120.1
120.1
119.4
2015
119.5
119.7
120.2
120.7
121.6
123.0
123.6
124.8
125.4
126.1
126.6
126.1
2016
126.3
126.0
126.0
127.3
128.6
130.1
131.1
131.1
130.9
131.4
131.2
130.4
2017
130.3
130.6
130.9
131.1
131.4
132.0
134.2
135.4
135.2
136.1
137.6
137.2
2018
136.9
136.4
136.5
137.1
137.8
138.5
139.8
140.4
140.2
140.7
140.8
140.1
2019
139.6
139.9
140.4
141.2
142.0
142.9
144.2
145.0
145.8
147.2
148.6
150.4
2020
150.2
149.1
148.6
151.4
150.9
151.8
153.9
154.7
156.4
158.4
158.9
157.3
2021
156.3
156.6
156.8
157.8
160.4
161.3
162.5
162.9
163.2
165.5
166.7
166.2
2022
165.7
166.1
167.7
170.1
171.7
172.6
173.4
174.3
175.3
176.7
176.5
175.7
2023
176.5
176.8
177.2
178.1
179.1
181.0
186.3
186.2
184.1
185.3
186.3
185.7
2024
185.5
185.8
185.8
186.7
187.7
190.2
193.0
193.0
194.2
196.8
196.5
Notes:
Annexure VI
Year
Jan
Feb
Mar
Apr
May
Jun
Jul
Aug
Sep
Oct
Nov
Dec
2014
8.60
7.88
8.25
8.48
8.33
6.77
7.39
7.03
5.63
4.62
3.27
4.28
2015
5.19
5.37
5.25
4.87
5.01
5.40
3.69
3.74
4.41
5.00
5.41
5.61
2016
5.69
5.26
4.83
5.47
5.76
5.77
6.07
5.05
4.39
4.20
3.63
3.41
2017
3.17
3.65
3.89
2.99
2.18
1.46
2.36
3.28
3.28
3.58
4.88
5.21
2018
5.07
4.44
4.28
4.58
4.87
4.92
4.17
3.69
3.70
3.38
2.33
2.11
2019
1.97
2.57
2.86
2.99
3.05
3.18
3.15
3.28
3.99
4.62
5.54
7.35
2020
7.59
6.58
5.84
–
–
6.23
6.73
6.69
7.27
7.61
6.93
4.59
2021
4.06
5.03
5.52
4.23
6.30
6.26
5.59
5.30
4.35
4.48
4.91
5.66
2022
6.01
6.07
6.95
7.79
7.04
7.01
6.71
7.00
7.41
6.77
5.88
5.72
2023
6.52
6.44
5.66
4.70
4.31
4.87
7.44
6.83
5.02
4.87
5.55
5.69
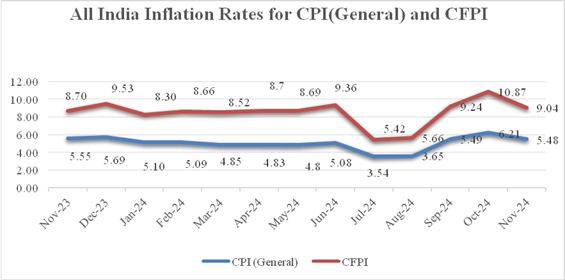
2024
5.10
5.09
4.85
4.83
4.80
5.08
3.60
3.65
5.49
6.21
5.48
Notes:
-
- Year-on-year inflation rate based on All India Consumer Price Index (CPI) for the month of November, 2024 over November, 2023 is 5.48% (Provisional). Corresponding inflation rates for rural and urban are 5.95% and 4.83%, respectively.