CONSUMER PRICE INDEX NUMBERS ON BASE 2012=100 FOR RURAL, URBAN AND COMBINED FOR THE MONTH OF MAY 2024
CONSUMER PRICE INDEX NUMBERS ON BASE 2012=100 FOR RURAL, URBAN AND COMBINED FOR THE MONTH OF MAY 2024
I. Key highlights:
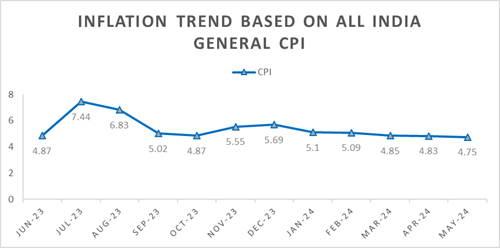
All India year-on-year inflation rates (%) based on CPI (General) and CFPI: May 2024 over May
2023
May 2024 (Prov.)
Apr. 2024 (Final)
May 2023
Rural
Urban
Combd.
Rural
Urban
Combd.
Rural
Urban
Combd.
Inflation
CPI (General)
5.28
4.15
4.75
5.43
4.11
4.83
4.23
4.33
4.31
CFPI
8.62
8.83
8.69
8.75
8.56
8.70
3.30
2.43
2.96
Index
CPI (General)
189.3
185.6
187.6
188.5
184.7
186.7
179.8
178.2
179.1
CFPI
190.2
197.1
192.6
188.9
195.4
191.2
175.1
181.1
177.2
Notes: Prov. – Provisional, Combd. – Combined
Monthly changes (%) in All India CPI (General) and CFPI: May 2024 over April 2024
Indices
May 2024 (Prov.)
Apr. 2024 (Final)
Monthly change (%)
Rural
Urban
Combd.
Rural
Urban
Combd.
Rural
Urban
Combd.
CPI (General)
189.3
185.6
187.6
188.5
184.7
186.7
0.42
0.49
0.48
CFPI
190.2
197.1
192.6
188.9
195.4
191.2
0.69
0.87
0.73
Note: Figures of May 2024 are provisional.
List of Annex
Annex
Title
I
All-India General, Group and Sub-group level CPI and CFPI numbers for April 2024 (Final) and May 2024 (Provisional) for Rural, Urban and Combined
II
All-India inflation rates (%) for General, Group and Sub-group level CPI and CFPI numbers for May 2024 (Provisional) for Rural, Urban and Combined
III
General CPI for States for Rural, Urban and Combined for April 2024 (Final) and May 2024 (Provisional)
IV
Year-on-year inflation rates (%) of major States for Rural, Urban and Combined for May 2024 (Provisional)
Annex I
All-India General, Group and Sub-group level CPI and CFPI numbers for April 2024 (Final) and May 2024 (Provisional) for Rural, Urban and Combined
(Base: 2012=100)
Group Code
Sub-group Code
Description
Rural
Urban
Combined
Weights
Apr. 24 Index
(Final)
May 24 Index
(Prov.)
Weights
Apr. 24 Index
(Final)
May 24 Index (Prov.)
Weights
Apr. 24 Index
(Final)
May 24 Index
(Prov.)
(1)
(2)
(3)
(4)
(5)
(6)
(7)
(8)
(9)
(10)
(11)
(12)
1.1.01
Cereals and products
12.35
188.8
188.7
6.59
188.9
189.0
9.67
188.8
188.8
1.1.02
Meat and fish
4.38
223.1
226.5
2.73
232.8
236.3
3.61
226.5
229.9
1.1.03
Egg
0.49
180.2
184.9
0.36
184.2
188.9
0.43
181.7
186.4
1.1.04
Milk and products
7.72
183.6
184.1
5.33
184.0
184.3
6.61
183.7
184.2
1.1.05
Oils and fats
4.21
160.4
160.5
2.81
154.9
155.2
3.56
158.4
158.6
1.1.06
Fruits
2.88
182.8
180.6
2.90
188.6
187.3
2.89
185.5
183.7
1.1.07
Vegetables
7.46
184.9
190.7
4.41
225.4
232.8
6.04
198.6
205.0
1.1.08
Pulses and products
2.95
200.7
203.7
1.73
206.2
209.7
2.38
202.6
205.7
1.1.09
Sugar and Confectionery
1.70
127.8
128.9
0.97
130.2
131.3
1.36
128.6
129.7
1.1.10
Spices
3.11
231.8
229.2
1.79
224.7
223.6
2.50
229.4
227.3
1.2.11
Non-alcoholic beverages
1.37
182.3
182.4
1.13
170.5
170.8
1.26
177.4
177.6
1.1.12
Prepared meals, snacks, sweets etc.
5.56
196.1
196.6
5.54
204.9
205.5
5.55
200.2
200.7
1
Food and beverages
54.18
189.5
190.6
36.29
196.1
197.6
45.86
191.9
193.2
2
Pan, tobacco and intoxicants
3.26
204.9
205.5
1.36
211.2
211.6
2.38
206.6
207.1
3.1.01
Clothing
6.32
196.2
196.5
4.72
186.3
186.7
5.58
192.3
192.6
3.1.02
Footwear
1.04
191.1
191.0
0.85
172.8
173.0
0.95
183.5
183.5
3
Clothing and footwear
7.36
195.5
195.7
5.57
184.2
184.7
6.53
191.0
191.3
4
Housing
–
–
–
21.67
179.9
180.1
10.07
179.9
180.1
5
Fuel and light
7.94
179.5
180.1
5.58
166.0
168.7
6.84
174.4
175.8
6.1.01
Household goods and services
3.75
183.8
183.9
3.87
174.4
174.8
3.80
179.4
179.6
6.1.02
Health
6.83
194.9
195.6
4.81
189.6
190.1
5.89
192.9
193.5
6.1.03
Transport and communication
7.60
171.8
171.8
9.73
161.4
161.5
8.59
166.3
166.4
6.1.04
Recreation and amusement
1.37
178.1
178.5
2.04
173.0
173.2
1.68
175.2
175.5
6.1.05
Education
3.46
186.7
186.9
5.62
181.8
182.4
4.46
183.8
184.3
6.1.06
Personal care and effects
4.25
197.0
198.7
3.47
198.8
200.6
3.89
197.7
199.5
6
Miscellaneous
27.26
185.4
185.9
29.53
176.8
177.3
28.32
181.2
181.7
General Index (All Groups)
100.00
188.5
189.3
100.00
184.7
185.6
100.00
186.7
187.6
Consumer Food Price Index (CFPI)
47.25
188.9
190.2
29.62
195.4
197.1
39.06
191.2
192.6
Notes:
Annex II
All-India year-on-year inflation rates (%) for General, Group and Sub-group level CPI and CFPI numbers for May 2024 (Provisional) for Rural, Urban and Combined
(Base: 2012=100)
Group Code
Sub-group Code
Description
Rural
Urban
Combined
May 23 Index
(Final)
May 24
Index
(Prov.)
Inflation Rate
(%)
May 23 Index
(Final)
May 24
Index
(Prov.)
Inflation Rate
(%)
May 23 Index
(Final)
May 24
Index
(Prov.)
Inflation Rate
(%)
(1)
(2)
(3)
(4)
(5)
(6)
(7)
(8)
(9)
(10)
(11)
(12)
1.1.01
Cereals and products
173.2
188.7
8.95
174.7
189.0
8.19
173.7
188.8
8.69
1.1.02
Meat and fish
211.5
226.5
7.09
219.4
236.3
7.70
214.3
229.9
7.28
1.1.03
Egg
171.0
184.9
8.13
176.7
188.9
6.90
173.2
186.4
7.62
1.1.04
Milk and products
179.6
184.1
2.51
179.4
184.3
2.73
179.5
184.2
2.62
1.1.05
Oils and fats
173.3
160.5
-7.39
164.4
155.2
-5.60
170.0
158.6
-6.71
1.1.06
Fruits
169.0
180.6
6.86
175.8
187.3
6.54
172.2
183.7
6.68
1.1.07
Vegetables
148.7
190.7
28.24
185.0
232.8
25.84
161.0
205.0
27.33
1.1.08
Pulses and products
174.9
203.7
16.47
176.9
209.7
18.54
175.6
205.7
17.14
1.1.09
Sugar and Confectionery
121.9
128.9
5.74
124.2
131.3
5.72
122.7
129.7
5.70
1.1.10
Spices
221.0
229.2
3.71
211.9
223.6
5.52
218.0
227.3
4.27
1.2.11
Non-alcoholic beverages
178.7
182.4
2.07
165.9
170.8
2.95
173.4
177.6
2.42
1.1.12
Prepared meals, snacks, sweets etc.
191.1
196.6
2.88
197.7
205.5
3.95
194.2
200.7
3.35
1
Food and beverages
176.8
190.6
7.81
183.1
197.6
7.92
179.1
193.2
7.87
2
Pan, tobacco and intoxicants
199.9
205.5
2.80
204.2
211.6
3.62
201.0
207.1
3.03
3.1.01
Clothing
191.2
196.5
2.77
181.3
186.7
2.98
187.3
192.6
2.83
3.1.02
Footwear
187.9
191.0
1.65
168.1
173.0
2.91
179.7
183.5
2.11
3
Clothing and footwear
190.8
195.7
2.57
179.3
184.7
3.01
186.2
191.3
2.74
4
Housing
–
–
–
175.6
180.1
2.56
175.6
180.1
2.56
5
Fuel and light
182.5
180.1
-1.32
183.4
168.7
-8.02
182.8
175.8
-3.83
6.1.01
Household goods and services
179.8
183.9
2.28
170.1
174.8
2.76
175.2
179.6
2.51
6.1.02
Health
187.8
195.6
4.15
182.2
190.1
4.34
185.7
193.5
4.20
6.1.03
Transport and communication
169.7
171.8
1.24
160.4
161.5
0.69
164.8
166.4
0.97
6.1.04
Recreation and amusement
173.8
178.5
2.70
169.2
173.2
2.36
171.2
175.5
2.51
6.1.05
Education
180.3
186.9
3.66
174.8
182.4
4.35
177.1
184.3
4.07
6.1.06
Personal care and effects
184.9
198.7
7.46
185.6
200.6
8.08
185.2
199.5
7.72
6
Miscellaneous
179.5
185.9
3.57
171.6
177.3
3.32
175.7
181.7
3.41
General Index (All Groups)
179.8
189.3
5.28
178.2
185.6
4.15
179.1
187.6
4.75
Consumer Food Price Index
175.1
190.2
8.62
181.1
197.1
8.83
177.2
192.6
8.69
Notes:
Annex III
General CPI for States for Rural, Urban and Combined for April 2024 (Final) and May 2024 (Provisional)
(Base: 2012=100)
Sl. No.
Name of the State/UT
Rural
Urban
Combined
Weights
Apr. 24 Index
(Final)
May 24 Index
(Prov.)
Weights
Apr. 24 Index
(Final)
May 24 Index
(Prov.)
Weights
Apr. 24 Index
(Final)
May 24 Index
(Prov.)
(1)
(2)
(3)
(4)
(5)
(6)
(7)
(8)
(9)
(10)
(11)
1
Andhra Pradesh
5.40
192.8
194.8
3.64
192.9
194.8
4.58
192.8
194.8
2
Arunachal Pradesh
0.14
191.7
192.9
0.06
—
—
0.10
191.7
192.9
3
Assam
2.63
190.0
190.6
0.79
186.0
187.8
1.77
189.2
190.0
4
Bihar
8.21
181.7
183.4
1.62
189.7
191.1
5.14
182.9
184.5
5
Chhattisgarh
1.68
179.0
178.9
1.22
176.2
176.6
1.46
177.9
178.0
6
Delhi
0.28
169.7
169.7
5.64
169.2
168.9
2.77
169.2
168.9
7
Goa
0.14
171.4
172.0
0.25
176.0
175.8
0.19
174.2
174.3
8
Gujarat
4.54
184.6
185.5
6.82
175.1
175.3
5.60
179.2
179.7
9
Haryana
3.30
190.4
190.3
3.35
178.8
179.3
3.32
185.0
185.1
10
Himachal Pradesh
1.03
175.6
175.4
0.26
180.4
180.3
0.67
176.5
176.3
11
Jharkhand
1.96
182.3
182.6
1.39
185.2
186.7
1.69
183.4
184.2
12
Karnataka
5.09
191.1
193.5
6.81
193.5
195.5
5.89
192.4
194.6
13
Kerala
5.50
196.5
197.9
3.46
193.5
194.6
4.55
195.4
196.7
14
Madhya Pradesh
4.93
185.2
185.0
3.97
188.0
187.9
4.48
186.4
186.2
15
Maharashtra
8.25
187.0
188.0
18.86
180.6
181.5
13.18
182.7
183.7
16
Manipur
0.23
218.5
218.4
0.12
183.8
185.7
0.18
207.5
208.1
17
Meghalaya
0.28
171.6
173.2
0.15
177.4
177.5
0.22
173.4
174.5
18
Mizoram
0.07
204.0
204.5
0.13
174.4
175.9
0.10
185.9
187.0
19
Nagaland
0.14
195.4
195.5
0.12
178.8
179.6
0.13
188.3
188.7
20
Odisha
2.93
190.5
190.8
1.31
182.6
183.0
2.18
188.3
188.6
21
Punjab
3.31
182.0
182.1
3.09
173.8
174.0
3.21
178.3
178.5
22
Rajasthan
6.63
185.4
184.9
4.23
184.0
184.0
5.51
184.9
184.6
23
Sikkim
0.06
196.1
197.3
0.03
185.6
186.0
0.05
192.7
193.6
24
Tamil Nadu
5.55
194.7
196.2
9.20
192.8
194.8
7.25
193.6
195.4
25
Telangana
3.16
203.2
204.3
4.41
195.7
197.6
3.74
199.1
200.6
26
Tripura
0.35
207.2
207.3
0.14
195.5
197.2
0.25
204.2
204.7
27
Uttar Pradesh
14.83
187.5
187.5
9.54
185.9
185.9
12.37
186.9
186.9
28
Uttarakhand
1.06
182.5
183.0
0.73
185.1
186.5
0.91
183.5
184.3
29
West Bengal
6.99
190.6
192.9
7.20
188.6
190.1
7.09
189.7
191.6
30
Andaman & Nicobar Islands
0.05
193.7
198.2
0.07
183.3
186.2
0.06
188.4
192.1
31
Chandigarh
0.02
183.1
183.5
0.34
173.7
173.5
0.17
174.2
174.1
32
Dadra & Nagar Haveli
0.02
173.8
174.8
0.04
181.0
181.1
0.03
178.6
179.0
33
Daman & Diu
0.02
186.7
186.6
0.02
186.7
184.8
0.02
186.7
185.8
34
Jammu & Kashmir*
1.14
197.0
197.0
0.72
192.7
192.8
0.94
195.5
195.5
35
Lakshadweep
0.01
193.9
194.4
0.01
177.2
182.8
0.01
185.4
188.5
36
Puducherry
0.08
195.3
197.9
0.27
190.7
191.9
0.17
191.9
193.4
All India
100.00
188.5
189.3
100.00
184.7
185.6
100.00
186.7
187.6
Notes:
and Ladakh (erstwhile State of Jammu & Kashmir).
Annex IV
Year-on-year inflation rates (%) of major@ States for Rural, Urban and Combined for May 2024 (Provisional)
(Base: 2012=100)
Sl. No.
Name of the State/UT
Rural
Urban
Combined
May 23 Index
(Final)
May 24
Index
(Prov.)
Inflation Rate
(%)
May 23 Index
(Final)
May 24
Index
(Prov.)
Inflation Rate
(%)
May 23 Index
(Final)
May 24
Index
(Prov.)
Inflation Rate
(%)
(1)
(2)
(3)
(4)
(5)
(6)
(7)
(8)
(9)
(10)
(11)
1
Andhra Pradesh
183.1
194.8
6.39
185.5
194.8
5.01
184.0
194.8
5.87
2
Assam
181.0
190.6
5.30
179.2
187.8
4.80
180.6
190.0
5.20
3
Bihar
173.9
183.4
5.46
181.7
191.1
5.17
175.0
184.5
5.43
4
Chhattisgarh
169.9
178.9
5.30
168.4
176.6
4.87
169.3
178.0
5.14
5
Delhi
166.9
169.7
1.68
165.5
168.9
2.05
165.6
168.9
1.99
6
Gujarat
177.1
185.5
4.74
168.4
175.3
4.10
172.2
179.7
4.36
7
Haryana
179.2
190.3
6.19
171.7
179.3
4.43
175.7
185.1
5.35
8
Himachal Pradesh
168.8
175.4
3.91
176.6
180.3
2.10
170.2
176.3
3.58
9
Jharkhand
175.7
182.6
3.93
180.1
186.7
3.66
177.4
184.2
3.83
10
Karnataka
180.2
193.5
7.38
186.2
195.5
4.99
183.4
194.6
6.11
11
Kerala
187.0
197.9
5.83
185.5
194.6
4.91
186.5
196.7
5.47
12
Madhya Pradesh
175.2
185.0
5.59
181.6
187.9
3.47
177.8
186.2
4.72
13
Maharashtra
181.5
188.0
3.58
174.3
181.5
4.13
176.7
183.7
3.96
14
Odisha
178.9
190.8
6.65
174.0
183.0
5.17
177.5
188.6
6.25
15
Punjab
175.4
182.1
3.82
167.4
174.0
3.94
171.8
178.5
3.90
16
Rajasthan
176.2
184.9
4.94
174.6
184.0
5.38
175.6
184.6
5.13
17
Tamil Nadu
185.1
196.2
6.00
185.7
194.8
4.90
185.5
195.4
5.34
18
Telangana
193.0
204.3
5.85
186.3
197.6
6.07
189.3
200.6
5.97
19
Uttar Pradesh
177.1
187.5
5.87
178.8
185.9
3.97
177.7
186.9
5.18
20
Uttarakhand
176.6
183.0
3.62
181.2
186.5
2.92
178.3
184.3
3.37
21
West Bengal
185.4
192.9
4.05
185.2
190.1
2.65
185.3
191.6
3.40
22
Jammu & Kashmir*
187.8
197.0
4.90
188.7
192.8
2.17
188.1
195.5
3.93
All India
179.8
189.3
5.28
178.2
185.6
4.15
179.1
187.6
4.75
Notes:
CLICK HERE TO SEE THE RELEASE IN PDF