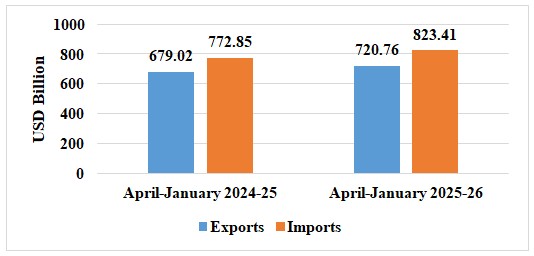
The cumulative exports (merchandise & services) during April-January 2025-26 is estimated at US$ 720.76 Billion, as compared to US$ 679.02 Billion in April-January 2024-25, an estimated growth of 6.15%
The cumulative exports (merchandise & services) during April-January 2025-26 is estimated at US$ 720.76 Billion, as compared to US$ 679.02 Billion in April-January 2024-25, an estimated growth of 6.15%
January 2026
April-January 2025-26
Table 1: Trade during January 2026*
January 2026
(US$ Billion)
January 2025
(US$ Billion)
Merchandise
Exports
36.56
36.34
Imports
71.24
59.77
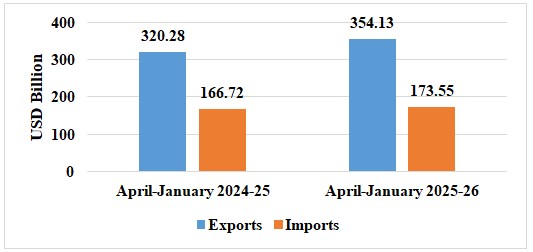
Services*
Exports
43.90
34.75
Imports
19.60
16.71
Total Trade
(Merchandise +Services) *
Exports
80.45
71.09
Imports
90.83
76.48
Trade Balance
-10.38
-5.39
* Note: The latest data for services sector released by RBI is for December 2025. The data for January 2026 is an estimation. (ii) Data for April-January 2024-25 and April-September 2025 has been revised on pro-rata basis using quarterly balance of payments data.
Fig 1: Total Trade during January 2026*
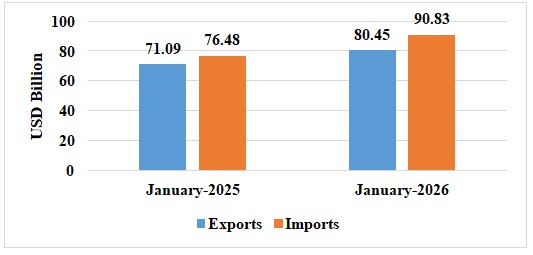
Table 2: Trade during April-January 2025-26*
April-January 2025-26
(US$ Billion)
April-January 2024-25
(US$ Billion)
Merchandise
Exports
366.63
358.75
Imports
649.86
606.13
Services*
Exports
354.13
320.28
Imports
173.55
166.72
Total Trade
(Merchandise +Services) *
Exports
720.76
679.02
Imports
823.41
772.85
Trade Balance
-102.65
-93.83
Fig 2: Total Trade during April-January 2025-26*
MERCHANDISE TRADE
Fig 3: Merchandise Trade during January 2026
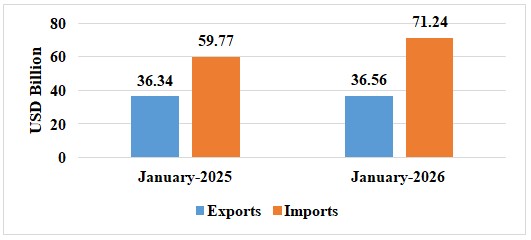
Fig 4: Merchandise Trade during April-January 2025-26
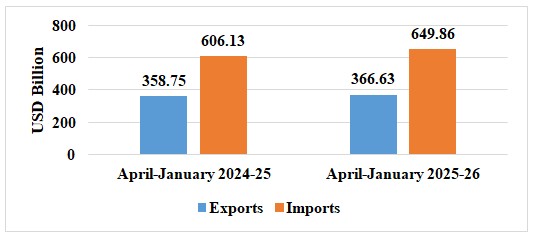
Table 3: Trade excluding Petroleum and Gems & Jewellery during January 2026
(US$ Billion)
January 2025 (US$ Billion)
Non- petroleum exports
32.78
32.86
Non- petroleum imports
57.83
46.33
Non-petroleum & Non-Gems & Jewellery exports
30.47
29.86
Non-petroleum & Non-Gems & Jewellery imports
42.56
41.53
Note: Gems & Jewellery Imports include Gold, Silver & Pearls, precious & Semi-precious stones
Fig 5: Trade excluding Petroleum and Gems & Jewellery during January 2026
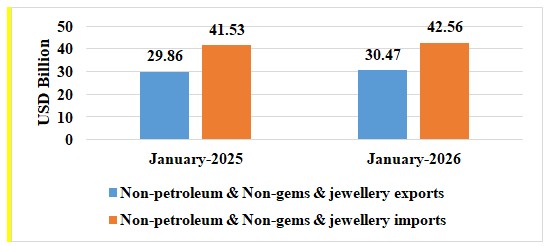
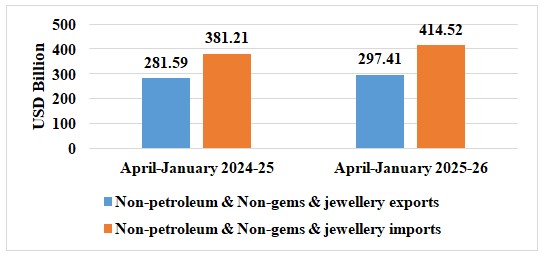
Table 4: Trade excluding Petroleum and Gems & Jewellery during April-January 2025-26
(US$ Billion)
April-January 2024-25
(US$ Billion)
Non- petroleum exports
320.94
305.98
Non- petroleum imports
501.04
451.25
Non-petroleum & Non Gems & Jewellery exports
297.41
281.59
Non-petroleum & Non Gems & Jewellery imports
414.52
381.21
Note: Gems & Jewellery Imports include Gold, Silver & Pearls, precious & Semi-precious stones
Fig 6: Trade excluding Petroleum and Gems & Jewellery during April-January 2025-26
SERVICES TRADE
Fig 7: Services Trade during January 2026*
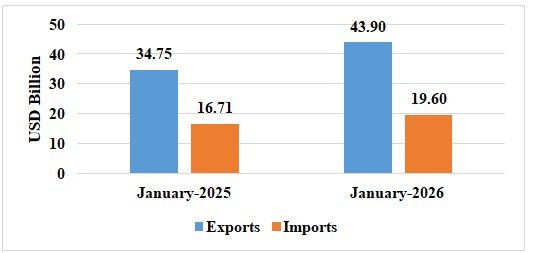
Fig 8: Services Trade during April-January 2025-26*