The cumulative exports (merchandise & services) during April-September 2025 is estimated at US$ 413.30 Billion, as compared to US$ 395.71 Billion in April-September 2024, an estimated growth of 4.45%.
The cumulative exports (merchandise & services) during April-September 2025 is estimated at US$ 413.30 Billion, as compared to US$ 395.71 Billion in April-September 2024, an estimated growth of 4.45%.
September 2025
April-September 2025
India’s total exports (Merchandise and Services combined) for September 2025* is estimated at US$ 67.20 Billion, registering a positive growth of 0.78 percent vis-à-vis September 2024. Total imports (Merchandise and Services combined) for September 2025* is estimated at US$ 83.82 Billion, registering a positive growth of 11.34 percent vis-à-vis September 2024.
Table 1: Trade during September 2025*
September 2025
(US$ Billion)
September 2024
(US$ Billion)
Merchandise
Exports
36.38
34.08
Imports
68.53
58.74
Services*
Exports
30.82
32.60
Imports
15.29
16.54
Total Trade
(Merchandise +Services) *
Exports
67.20
66.68
Imports
83.82
75.28
Trade Balance
-16.61
-8.60
* Note: The latest data for services sector released by RBI is for August 2025. The data for September 2025 is an estimation. (ii) Data for April-September 2024 and April-June 2025 has been revised on pro-rata basis using quarterly balance of payments data.
Fig 1: Total Trade during September 2025*
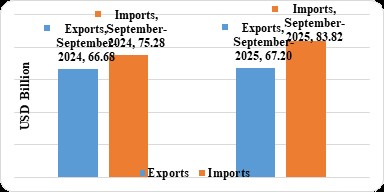
Table 2: Trade during April-September 2025*
April-September 2025
(US$ Billion)
April-September 2024
(US$ Billion)
Merchandise
Exports
220.12
213.68
Imports
375.11
358.85
Services*
Exports
193.18
182.03
Imports
97.68
97.73
Total Trade
(Merchandise +Services) *
Exports
413.30
395.71
Imports
472.79
456.58
Trade Balance
-59.48
-60.87
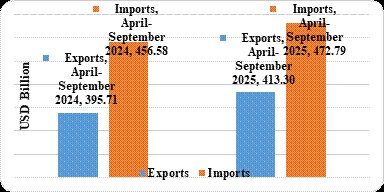
Fig 2: Total Trade during April-September 2025*
MERCHANDISE TRADE
Fig 3: Merchandise Trade during September 2025
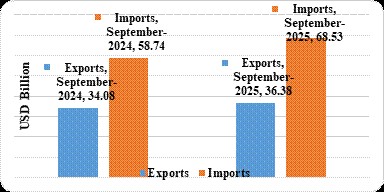
Fig 4: Merchandise Trade during April-September 2025
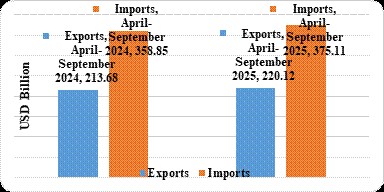
Table 3: Trade excluding Petroleum and Gems & Jewellery during September 2025
(US$ Billion)
September 2024
(US$ Billion)
Non- petroleum exports
31.43
29.78
Non- petroleum imports
54.50
43.83
Non-petroleum & Non-Gems & Jewellery exports
28.59
26.95
Non-petroleum & Non-Gems & Jewellery imports
41.77
36.96
Note: Gems & Jewellery Imports include Gold, Silver & Pearls, precious & Semi-precious stones
Fig 5: Trade excluding Petroleum and Gems & Jewellery during September 2025
Table 4: Trade excluding Petroleum and Gems & Jewellery during April-September 2025
(US$ Billion)
April-September 2024
(US$ Billion)
Non- petroleum exports
189.49
177.03
Non- petroleum imports
282.98
265.80
Non-petroleum & Non Gems & Jewellery exports
175.29
163.09
Non-petroleum & Non Gems & Jewellery imports
243.58
224.97
Note: Gems & Jewellery Imports include Gold, Silver & Pearls, precious & Semi-precious stones
Fig 6: Trade excluding Petroleum and Gems & Jewellery during April-September 2025
SERVICES TRADE
Fig 7: Services Trade during September 2025*
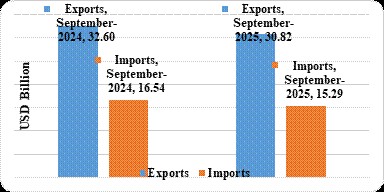
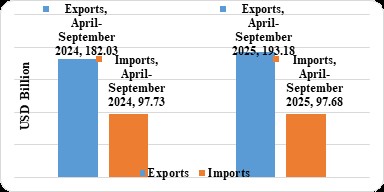
Fig 8: Services Trade during April-September 2025*
Department of Commerce acknowledges the latest growth projections for India as published in the October 2025 update of the International Monetary Fund’s World Economic Outlook (WEO).
India’s GDP growth is now projected to reach 6.6 percent in 2025, followed by 6.2 percent in 2026. This represents an upward revision for 2025 compared to the July WEO update, driven by strong performance in the first quarter of the fiscal year. As per the IMF WEO update, the positive momentum has more than offset the impact of the increase in the United States’ effective tariff rate on Indian imports since July.
India continues to be a bright spot in the global economy and the Department of Commerce will work in close coordination with concerned stakeholders to sustain this momentum and ensure inclusive, sustainable growth.