Highlights of Telecom Subscription Data as on 31st August 2025
Highlights of Telecom Subscription Data as on 31st August 2025
Particulars
Wireless*
Wireline
Total
(Wireless+
Wireline)
Broadband Subscribers (Million)
945.51
44.07
989.58
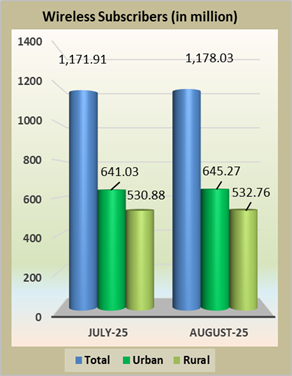
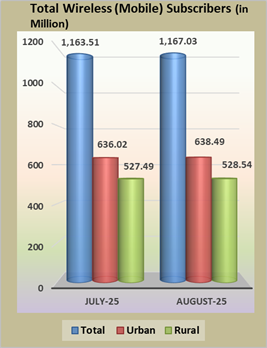
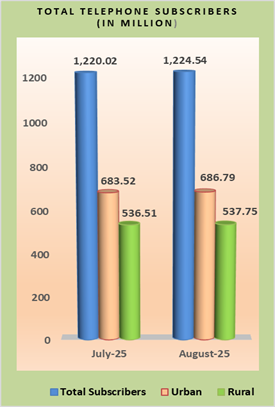
Urban Telephone Subscribers (Million)
645.27
41.52
686.79
Net Addition in August 2025 (Million)
4.23
-0.96
3.27
Monthly Growth Rate
0.66%
-2.27%
0.48%
Rural Telephone Subscribers (Million)
532.76
4.99
537.75
Net Addition in August 2025 (Million)
1.88
-0.64
1.24
Monthly Growth Rate
0.36%
-11.44%
0.23%
Total Telephone Subscribers (Million)
1178.03
46.51
1224.54
Net Addition in August 2025 (Million)
6.12
-1.61
4.51
Monthly Growth Rate
0.52%
-3.34%
0.37%
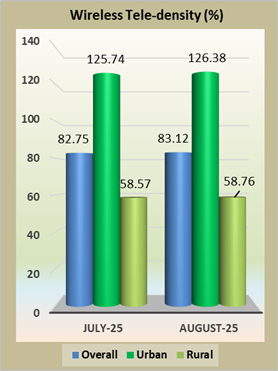
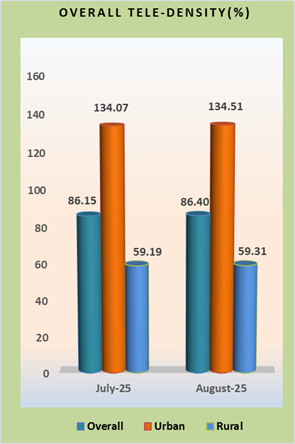
Overall Tele-density@(%)
83.12%
3.28%
86.40%
Urban Tele-density@(%)
126.38%
8.13%
134.51%
Rural Tele-density@(%)
58.76%
0.55%
59.31%
Share of Urban Subscribers
54.78%
89.28%
56.09%
Share of Rural Subscribers
45.22%
10.72%
43.91%
Note:
* Wireless includes fixed wireless access (FWA) subscription also.
@ Based on the projection of population from the ‘Report of the Technical Group on Population Projections for India and States 2011 – 2036’.
# VLR is acronym of Visitor Location Register. The dates of peak VLR for various telecom service providers (TSPs) are different in different service areas.
Information in this Press Release is based on the data provided by the TSPs to TRAI.
Segment–wise Broadband Subscribers and Monthly Growth Rate in the month of August 2025
Segment
Subscription
Broadband Subscribers
(in million)
Percent Change
July-2025
August-2025
Wired subscribers
Fixed (Wired) Access
(DSL, FTTx, Ethernet/LAN, Cable Modem, ILL)
45.49
44.07
-3.13%
Wireless Subscribers
Fixed Wireless Access [1]
(5G FWA, Wi-Fi, Wi-Max, Radio/UBR, Satellite)
8.79
11.40
29.69%
Mobile Wireless Access
(Handset/Dongle based-3G, 4G, 5G)
930.41
934.11
0.40%
Total Broadband Subscribers
984.69
989.58
0.50%
[1] Variation in FWA broadband is due to the separate reporting of Fixed Wireless (Unlicensed bands), earlier included under FTTx by M/s Reliance Jio Infocomm Limited.
Top five Broadband (Wired + Wireless) Service providers as on 31st August 2025
S.N.
Name of the Service Provider
Subscriber base
(In million)
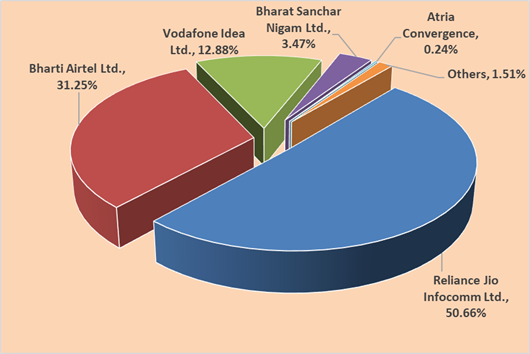
Reliance Jio Infocomm Ltd.
501.31
Bharti Airtel Ltd.
309.22
Vodafone Idea Ltd.
127.48
Bharat Sanchar Nigam Ltd.
34.31
Atria Convergence Technologies Ltd.
2.35
Market Share of Top Five Broadband (Wired + Wireless) Service Providers
98.49%
Service Provider-wise Market Share of Broadband (Wired + Wireless) Services as on 31st August 2025
Top Five Fixed (Wired) Access Broadband Service providers as on 31st August 2025
S.N.
Name of the Service Provider
Subscriber base
(In million)
Reliance Jio Infocomm Ltd.
13.00
Bharti Airtel Ltd.
9.68
Bharat Sanchar Nigam Ltd
4.38
Atria Convergence Technologies Ltd.
2.35
Kerala Vision Broadband Ltd.
1.40
Market Share of Top Five Fixed (Wired) Access Broadband Service Providers
69.90%
Top five Wireless (Fixed Wireless & Mobile) Access
Broadband Service providers as on 31st August 2025
S.N.
Name of the Service Provider
Subscriber base
(In million)
Reliance Jio Infocomm Ltd.
488.31
Bharti Airtel Ltd.
299.54
Vodafone Idea Ltd.
127.47
Bharat Sanchar Nigam Ltd..
29.93
IBus Virtual Network Services Private Limited
0.12
Market Share of Top Five Wireless (Fixed Wireless & Mobile) Access Broadband Service Providers
99.99%
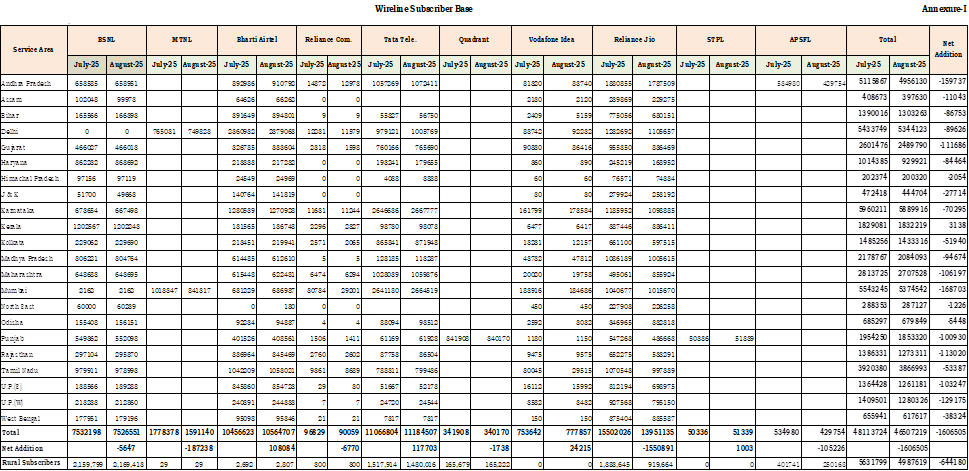
Annexure-I.
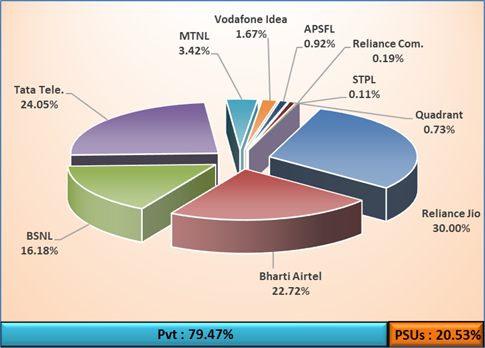
Access Service Provider-wise Market Share of wireline Subscribers as on 31st August 2025
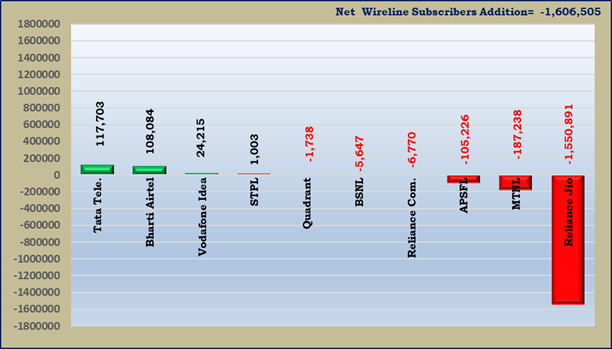
Access Service Provider-wise Net Addition/Decline in Wireline Subscribers during the month of August 2025
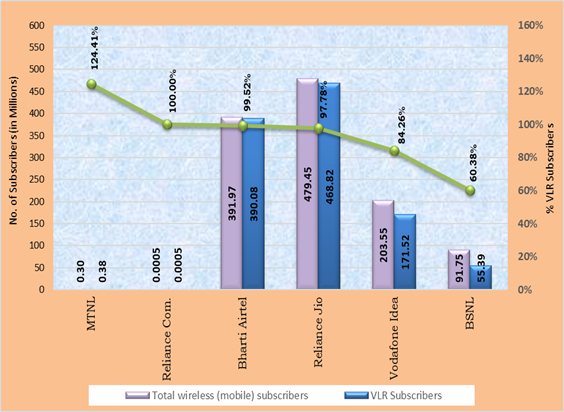
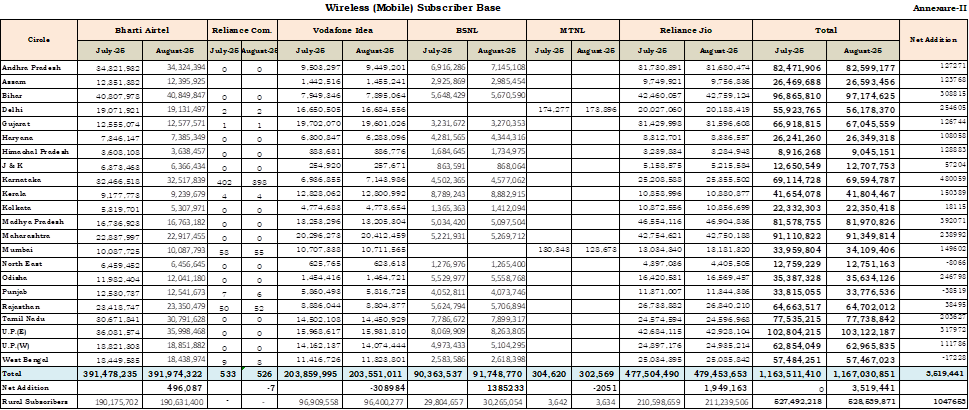
(A) Wireless (mobile) subscribers
The detailed statistics of wireless (mobile) subscriber base is available at Annexure-II.
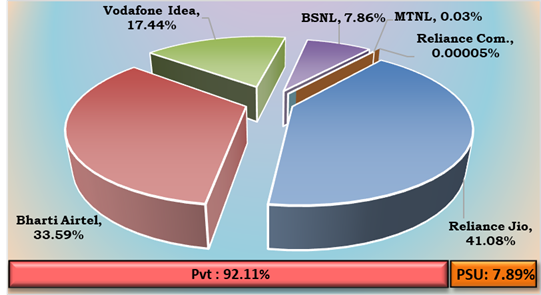
• As on 31st August 2025 the private access service providers held a market share of 92.11% of the wireless (mobile) subscribers, whereas PSU access service providers viz. BSNL and MTNL together held a market share of 7.89%.
Access Service Provider-wise Market Shares in term of Wireless (Mobile) Subscribers as on 31st August 2025
Net Addition/ Decline in Wireless (Mobile) Subscribers of Access Service Providers in the month of August 2025 Growth in Wireless (Mobile) Subscribers
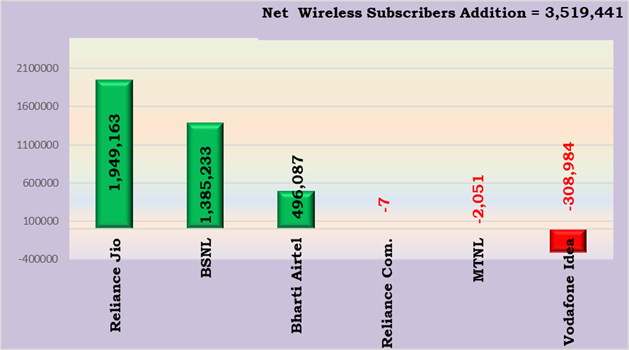
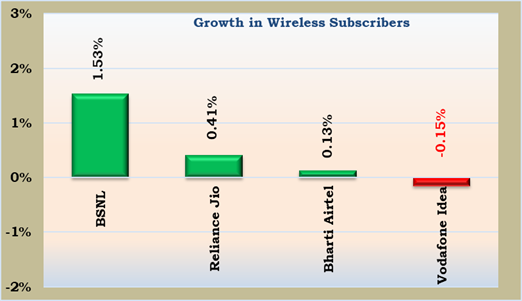
Major Access Service Provider-wise Monthly Growth/ Decline Rate of Wireless (Mobile) Subscribers in the month of August 2025
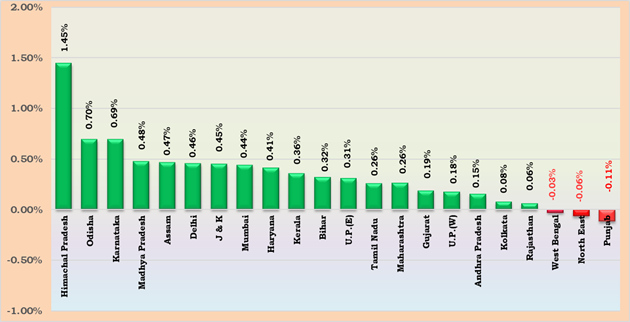
Service Area-wise Monthly Growth/ Decline Rate of Wireless (Mobile) Subscribers in the month of August 2025
(B) Wireless (FWA) subscribers
The Number of M2M cellular mobile connections increased from 84.62 million at the end of July 2025 to 89.70 million at the end of August 2025.
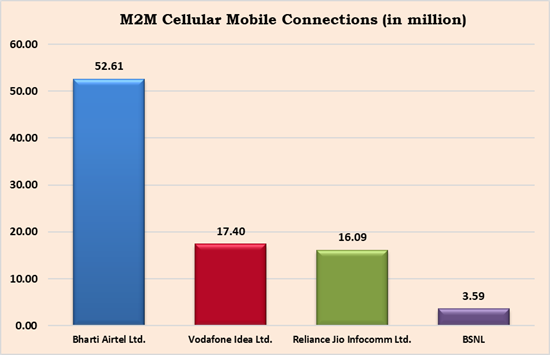
Bharti Airtel Limited has the highest number of M2M cellular mobile connections of 52.61 million with a market share of 58.66%, followed by Vodafone Idea Limited, Reliance Jio Infocom Limited and BSNL with market share of 19.40%, 17.94% and 4.01% respectively.
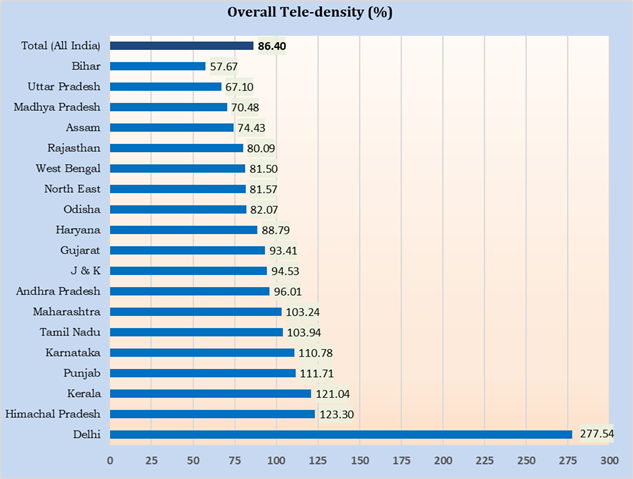
Overall Tele-density (LSA Wise) – As on 31st August 2025
Notes: –
Circle Category-wise Net Additions in Telephone Subscribers in the month of August 2025
Circle
Category
Net additions in the month of August 2025
Telephone Subscriber base as on 31st August 2025
Wireline segment
Wireless* segment
Wireline segment
Wireless* segment
Circle A
-501302
2034040
19910357
392166487
Circle B
-660696
2184599
11131988
476648195
Circle C
-134238
1189253
3312893
195571116
Metro
-310269
711591
12151981
113644307
All India
-1606505
6119483
46507219
1178030105
*Wireless includes FWA subscription also.
Circle Category-wise monthly and yearly Growth Rates in Telephone Subscribers in the month of August 2025
Circle Category
Monthly growth rate (%)
(July-25 to August-25)
Yearly growth rate (%)
(August-24 to August-25)
Wireline Segment
Wireless* Segment
Wireline Segment
Wireless* Segment
Circle A
-2.46%
0.52%
41.66%
0.89%
Circle B
-5.60%
0.46%
12.21%
0.26%
Circle C
-3.89%
0.61%
11.08%
2.79%
Metro
-2.49%
0.63%
31.01%
-0.80%
All India
-3.34%
0.52%
28.35%
0.78%
*Wireless includes FWA subscription also.
Note: Circle Category-Metro includes Delhi, Mumbai and Kolkata.
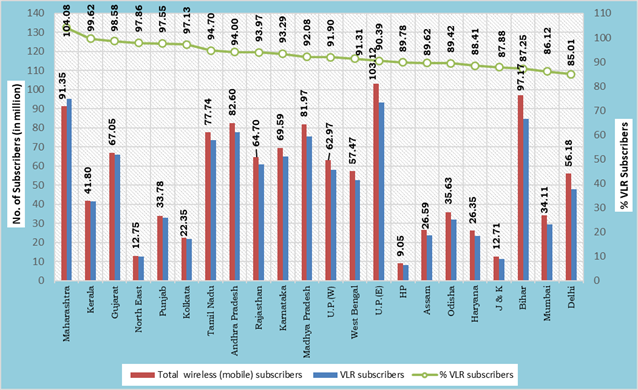
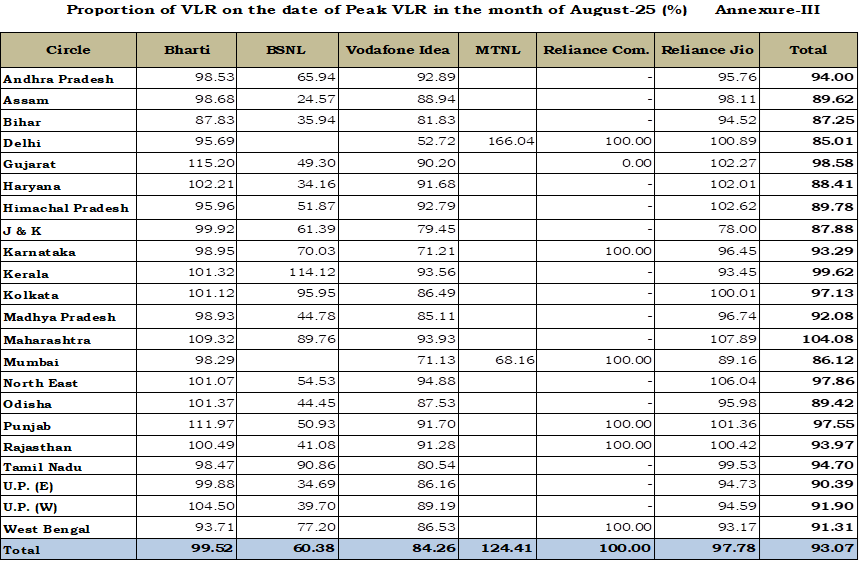
Access Service Provider-wise Percentage of VLR Subscribers in the month of August 2025
Service Area wise percentage of VLR Subscribers in the month of August 2025
Service Area Wise MNP Status
Zone-I
Zone–II
Service Area
Number of Porting Requests in
the month of
(in Million)
Service Area
Number of Porting Requests in
the month of (in Million)
July-25
August-25
July-25
August-25
Delhi
0.71
0.69
Andhra Pradesh
0.69
0.66
Gujarat
1.16
1.03
Assam
0.13
0.13
Haryana
0.45
0.45
Bihar
1.15
1.30
Himachal Pradesh
0.05
0.05
Karnataka
0.63
0.60
Jammu & Kashmir
0.08
0.07
Kerala
0.30
0.28
Maharashtra
1.13
1.06
Kolkata
0.19
0.20
Mumbai
0.29
0.28
Madhya Pradesh
1.47
1.45
Punjab
0.40
0.39
North East
0.03
0.03
Rajasthan
0.85
0.80
Odisha
0.25
0.25
UP (East)
2.13
2.09
Tamil Nadu
0.64
0.60
UP (West)
1.53
1.52
West Bengal
1.15
1.12
Total
8.77
8.42
Total
6.63
6.62
Total (Zone-I + Zone-II)
15.41
15.05
Contact details in case of any clarification: –
Shri Akhilesh Kumar Trivedi, Advisor (NSL-II),
Telecom Regulatory Authority of India
World Trade Centre, Tower-F,
Nauroji Nagar, New Delhi – 110029
Ph: 011-20907758 (S. B. Singh)
E-mail: advmn@trai.gov.in Pr. Advisor (NSL), TRAI
Note: Peak VLR figures in some circles of some of the service providers are more than their HLR figures due to a large number of inroamers.
Annexure IV
VLR Subscribers in the Wireless Segment
Home Location Register (HLR) is a central database that contains details of each mobile phone subscriber that is authorized to use the GSM core network. The HLRs store details of every SIM card issued by the service provider. Each SIM has a unique identifier called an International Mobile Subscriber Identity (IMSI), which is the primary key to each HLR record. The HLR data is stored for as long as a subscriber remains with the service provider. HLR also manages the mobility of subscribers by means of updating their position in administrative areas. It sends the subscriber data to a Visitor Location Register (VLR).
Subscriber numbers reported by the service providers is the difference between the numbers of IMSI registered in service provider’s HLR and sum of other figures as given below: –
1
Total IMSI’s in HLR (A)
2
Less: (B = a + b + c + d + e)
a.
Test/Service Cards
b.
Employees
c.
Stock in hand/in Distribution Channels (Active Card)
d.
Subscriber Retention period expired
e.
Service suspended pending disconnection
3
Subscribers Base (A-B)
Visitor Location Register (VLR) is a temporary database of the subscribers who have roamed into the particular area, which it serves. Each base station in the network is served by exactly one VLR; hence a subscriber cannot be present in more than one VLR at a time.
If subscriber is in active stage i.e. he is able to send/receive calls/SMSs he is available both in HLR and VLR. However, it may be possible that the subscriber is registered in HLR but not in VLR due to the reason that he is either switched-off or moved out of coverage area, not reachable etc. In such circumstances he will be available in HLR but not in VLR. This causes difference between subscriber number reported by the service providers based on HLR and numbers available in VLR.
The VLR subscriber data calculated here is based on active subscribers in VLR on the date of Peak subscriber number in VLR of the particular month for which the data is being collected. This data is to be taken from the switches having the purge time of not more than 72 hours.
5G FWA Subscriber Base
Annexure-V
Service Area
Bharti Airtel
Reliance Jio
Total
July-25
August-25
July-25
August-25
July-25
August-25
Andhra Pradesh
177,752
195,960
547,960
573,123
725,712
769,083
Assam
36,911
40,624
143,848
152,880
180,759
193,504
Bihar
74,641
85,980
490,871
525,129
565,512
611,109
Delhi
106,193
113,891
229,078
229,208
335,271
343,099
Gujarat
111,916
122,558
375,537
387,552
487,453
510,110
Haryana
54,399
59,338
186,951
195,556
241,350
254,894
Himachal Pradesh
8,825
9,695
58,402
62,206
67,227
71,901
J & K
32,137
35,003
144,039
150,144
176,176
185,147
Karnataka
174,477
190,348
351,817
363,327
526,294
553,675
Kerala
35,550
39,504
131,059
139,760
166,609
179,264
Kolkata
63,435
67,843
154,978
156,257
218,413
224,100
Madhya Pradesh
84,597
91,576
426,614
452,663
511,211
544,239
Maharashtra
170,668
185,785
512,281
532,893
682,949
718,678
Mumbai
70,080
75,632
93,080
95,525
163,160
171,157
North East
19,321
21,709
69,391
73,208
88,712
94,917
Odisha
43,173
47,296
211,432
226,688
254,605
273,984
Punjab
91,332
99,479
404,730
419,972
496,062
519,451
Rajasthan
116,617
127,478
363,258
381,286
479,875
508,764
Tamil Nadu
242,085
262,278
316,468
326,039
558,553
588,317
U.P.(E)
105,951
117,839
520,021
550,049
625,972
667,888
U.P.(W)
84,647
94,590
411,662
435,985
496,309
530,575
West Bengal
48,576
54,164
302,452
331,841
351,028
386,005
Total
1953283
2,138,570
6,445,929
6,761,291
8,399,212
8,899,861
Net Addition
185287
315362
500649
Monthly Growth%
9.49%
4.89%
5.96%
Annexure-VI
UBR FWA Subscriber Base
Service Area
Number of UBR FWA subscribers of Reliance Jio Infocomm Limited*
on 31.08.2025
Andhra Pradesh
157,025
Assam
17,555
Bihar
139,818
Delhi
144,120
Gujarat
152,408
Haryana
94,995
Himachal Pradesh
4,677
Jammu & Kashmir
39,283
Karnataka
120,346
Kerala
6,550
Kolkata
89,559
Madhya Pradesh
115,637
Maharashtra
172,621
Mumbai
34,078
North East
7,096
Odisha
25,851
Punjab
133,799
Rajasthan
154,604
Tamil Nadu
96,045
Uttar Pradesh (East)
150,701
Uttar Pradesh (West)
179,922
West Bengal
62,703
Total
2,099,393
* Only Reliance Jio Infocomm Limited has reported the information on the number of UBR FWA subscribers.
- In the month of August 2025 15.05 million subscribers submitted their requests for Mobile Number Portability (MNP).
- The Number of active wireless (Mobile) subscribers (on the date of peak VLR#) in August 2025 was 1086.18 million.