India’s Index of industrial production records growth of 3.5% in July 2025
India’s Index of industrial production records growth of 3.5% in July 2025
As per the revised calendar, the Quick Estimate of Index of Industrial Production (IIP) will now be released on 28th of every month (or next working day if 28th is a holiday). The index is compiled with data received from source agencies, which in turn receive the data from the producing factories/ establishments. These Quick Estimates will undergo revision in subsequent releases as per the revision policy of IIP.
2. Key Highlights:
3. Along with the Quick Estimate of IIP for the month of July 2025, the indices for June 2025 have undergone final revision in the light of the updated data received from the source agencies.
4. The Quick Estimates for July 2025 and the final revision for June 2025 have been compiled at weighted response rates of 89.5 percent and 93.1 percent.
5. Details of Quick Estimates of the Index of Industrial Production for the month of July 2025 at Sectoral, 2-digit level of National Industrial Classification (NIC-2008) and by Use-based classification are given at Statements I, II and III respectively. Also, for users to appreciate the changes in the industrial sector, Statement IV provides month-wise indices for the last 13 months, by industry groups (as per 2-digit level of NIC-2008) and sectors.
6. Release of the Index for August 2025 will be on Monday, 29th September 2025.
Note: –
STATEMENT I: INDEX OF INDUSTRIAL PRODUCTION – SECTORAL
(Base: 2011-12=100)
Month
Mining
Manufacturing
Electricity
General
(14.372472)
(77.63321)
(7.994318)
(100)
2024-25
2025-26
2024-25
2025-26
2024-25
2025-26
2024-25
2025-26
Apr
130.9
130.7
144.6
149.1
212.0
215.7
148.0
151.8
May
136.5
136.4
150.4
155.2
229.3
218.5
154.7
157.6
Jun
134.9
123.2
146.6
152.0
222.8
220.1
151.0
153.3
Jul*
116.1
107.7
148.8
156.9
220.2
221.5
149.8
155.0
Aug
107.1
146.1
212.3
145.8
Sep
111.7
147.2
206.9
146.9
Oct
128.5
148.4
207.8
150.3
Nov
133.8
147.0
184.1
148.1
Dec
143.2
157.2
192.8
158.0
Jan
150.7
159.5
201.9
161.6
Feb
141.9
148.4
194.0
151.1
Mar
158.1
162.4
219.5
166.3
Average
Apr-Jul
129.6
124.5
147.6
153.3
221.1
219.0
150.9
154.4
Growth over the corresponding period of previous year
Jun
10.3
-8.7
3.5
3.7
8.6
-1.2
4.9
1.5
Jul*
3.8
-7.2
4.7
5.4
7.9
0.6
5.0
3.5
Apr-Jul
6.9
-3.9
4.4
3.9
10.1
-0.9
5.4
2.3
*Figures for July 2025 are Quick Estimates.
Note : Indices for the months of Jun’25 incorporate updated production data.
STATEMENT II: INDEX OF INDUSTRIAL PRODUCTION – (2-DIGIT LEVEL)
(Base: 2011-12=100)
Industry
Description
Weight
Index
Cumulative Index
Percentage growth
code
Jul’24
Jul’25*
Apr-Jul
Jul’25*
Apr-Jul
2024-25
2025-26
2025-26
10
Manufacture of food products
5.302
119.9
118.4
118.6
119.1
-1.3
0.4
11
Manufacture of beverages
1.035
112.9
105.8
124.6
118.7
-6.3
-4.7
12
Manufacture of tobacco products
0.798
81.3
90.1
78.4
86.0
10.8
9.7
13
Manufacture of textiles
3.291
109.1
107.6
106.9
106.2
-1.4
-0.7
14
Manufacture of wearing apparel
1.322
111.7
115.3
115.8
120.9
3.2
4.4
15
Manufacture of leather and related products
0.502
102.0
98.9
98.3
95.4
-3.0
-3.0
16
Manufacture of wood and products of wood and cork, except furniture; manufacture of articles of straw and plaiting materials
0.193
99.1
116.2
96.9
107.0
17.3
10.4
17
Manufacture of paper and paper products
0.872
81.7
79.4
79.5
77.0
-2.8
-3.1
18
Printing and reproduction of recorded media
0.680
84.4
75.4
85.9
76.1
-10.7
-11.4
19
Manufacture of coke and refined petroleum products
11.775
140.9
142.4
137.3
138.8
1.1
1.1
20
Manufacture of chemicals and chemical products
7.873
135.2
132.6
131.8
127.2
-1.9
-3.5
21
Manufacture of pharmaceuticals, medicinal chemical and botanical products
4.981
224.7
232.9
233.2
232.2
3.6
-0.4
22
Manufacture of rubber and plastics products
2.422
116.9
113.4
113.2
116.7
-3.0
3.1
23
Manufacture of other non-metallic mineral products
4.085
136.3
149.2
147.1
156.0
9.5
6.1
24
Manufacture of basic metals
12.804
223.7
252.1
222.4
242.7
12.7
9.1
25
Manufacture of fabricated metal products, except machinery and equipment
2.655
93.7
103.1
91.5
99.4
10.0
8.6
26
Manufacture of computer, electronic and optical products
1.570
130.9
136.3
129.1
131.7
4.1
2.0
27
Manufacture of electrical equipment
2.998
131.8
152.8
125.4
138.5
15.9
10.4
28
Manufacture of machinery and equipment n.e.c.
4.765
126.2
133.7
119.4
128.7
5.9
7.8
29
Manufacture of motor vehicles, trailers and semi-trailers
4.857
133.5
143.2
130.8
141.7
7.3
8.3
30
Manufacture of other transport equipment
1.776
155.0
172.8
150.5
157.3
11.5
4.5
31
Manufacture of furniture
0.131
209.2
223.0
223.3
229.5
6.6
2.8
32
Other manufacturing
0.941
83.3
71.4
81.7
67.9
-14.3
-16.9
05
Mining
14.3725
116.1
107.7
129.6
124.5
-7.2
-3.9
10-32
Manufacturing
77.6332
148.8
156.9
147.6
153.3
5.4
3.9
35
Electricity
7.9943
220.2
221.5
221.1
219.0
0.6
-0.9
General Index
100.00
149.8
155.0
150.9
154.4
3.5
2.3
*Figures for July 2025 are Quick Estimates.
STATEMENT III: INDEX OF INDUSTRIAL PRODUCTION – USE-BASED
(Base :2011-12=100)
Primary goods
Capital goods
Intermediate goods
Infrastructure/ construction goods
Consumer durables
Consumer non-durables
Month
(34.048612)
(8.223043)
(17.221487)
(12.338363)
(12.839296)
(15.329199)
2024-25
2025-26
2024-25
2025-26
2024-25
2025-26
2024-25
2025-26
2024-25
2025-26
2024-25
2025-26
Apr
152.2
151.9
95.0
108.3
157.8
165.5
184.2
192.9
119.5
126.9
150.9
146.9
May
160.9
158.6
105.3
119.3
162.4
170.0
186.3
198.8
130.2
129.0
154.0
152.5
Jun
156.0
152.1
111.3
114.6
159.1
167.8
184.9
197.3
127.1
130.7
145.2
143.9
Jul*
150.1
147.6
114.0
119.7
164.6
174.1
179.7
201.0
126.6
136.3
147.1
147.8
Aug
141.6
107.4
162.3
181.5
129.8
141.8
Sep
141.3
116.5
160.8
178.8
132.9
145.7
Oct
149.8
109.2
165.0
184.2
129.8
146.4
Nov
147.7
106.7
158.5
177.3
121.5
158.1
Dec
157.7
114.7
170.1
195.4
123.8
166.9
Jan
162.8
119.3
172.5
200.2
130.0
165.1
Feb
152.3
115.4
159.1
191.7
126.4
146.7
Mar
169.5
136.3
175.6
214.6
138.8
149.0
Average
Apr-Jul
154.8
152.6
106.4
115.5
161.0
169.4
183.8
197.5
125.9
130.7
149.3
147.8
Growth over the corresponding period of previous year
Jun
6.3
-2.5
3.6
3.0
3.2
5.5
8.2
6.7
8.8
2.8
-1.0
-0.9
Jul*
5.9
-1.7
11.7
5.0
7.0
5.8
5.5
11.9
8.2
7.7
-4.2
0.5
Apr-Jul
6.6
-1.4
5.2
8.6
4.4
5.2
7.4
7.5
10.1
3.8
-1.3
-1.0
*Figures for July 2025 are Quick Estimates.
NOTE: Indices for the months of Jun’25 incorporate updated production data.
STATEMENT IV: MONTHLY INDEX OF INDUSTRIAL PRODUCTION – (2-DIGIT LEVEL)
(Base: 2011-12=100)
Industry code
Description
Weight
Jul-24
Aug-24
Sep-24
Oct-24
Nov-24
Dec-24
Jan-25
Feb-25
Mar-25
Apr-25
May-25
Jun-25
Jul-25
10
Manufacture of food products
5.3025
119.9
122.3
120.5
130.5
136.5
154.2
159.2
142.7
131.6
121.1
118.4
118.5
118.4
11
Manufacture of beverages
1.0354
112.9
100.3
101.8
102.7
99.4
104.2
117.1
116.9
133.4
121.9
131.4
115.7
105.8
12
Manufacture of tobacco products
0.7985
81.3
78.5
91.2
92.3
80.3
88.2
96.9
76.3
96.9
75.7
93.1
85.1
90.1
13
Manufacture of textiles
3.2913
109.1
109.4
109.3
111.1
106.2
114.2
113.7
106.7
113.0
105.7
103.8
107.8
107.6
14
Manufacture of wearing apparel
1.3225
111.7
112.5
103.7
104.0
110.3
119.1
121.1
121.4
144.8
114.2
126.5
127.5
115.3
15
Manufacture of leather and related products
0.5021
102.0
94.3
89.5
87.0
76.3
89.2
93.8
88.1
88.8
88.4
97.9
96.2
98.9
16
Manufacture of wood and products of wood and cork, except furniture; manufacture of articles of straw and plaiting materials
0.1930
99.1
108.1
106.7
103.2
98.2
115.0
104.4
106.8
117.2
105.0
102.4
104.4
116.2
17
Manufacture of paper and paper products
0.8724
81.7
83.0
81.2
78.3
75.0
76.9
76.7
72.2
78.2
73.7
77.4
77.3
79.4
18
Printing and reproduction of recorded media
0.6798
84.4
83.3
84.7
78.0
82.6
89.9
83.3
78.9
82.2
75.3
77.1
76.7
75.4
19
Manufacture of coke and refined petroleum products
11.7749
140.9
130.8
128.8
132.8
135.6
147.4
146.3
131.8
146.0
132.5
142.2
138.2
142.4
20
Manufacture of chemicals and chemical products
7.8730
135.2
129.5
129.4
129.4
123.2
131.0
130.7
121.9
129.8
121.8
127.9
126.6
132.6
21
Manufacture of pharmaceuticals, medicinal chemical and botanical products
4.9810
224.7
212.6
222.9
216.9
251.4
259.1
246.1
211.8
218.3
231.5
243.5
220.8
232.9
22
Manufacture of rubber and plastics products
2.4222
116.9
115.5
117.6
116.6
103.6
107.0
118.7
114.6
118.9
117.0
121.8
114.7
113.4
23
Manufacture of other non-metallic mineral products
4.0853
136.3
139.8
137.6
144.3
136.7
157.7
162.3
159.8
180.2
156.7
159.4
158.7
149.2
24
Manufacture of basic metals
12.8043
223.7
225.6
219.7
228.2
222.0
236.8
242.2
224.3
252.2
235.6
243.5
239.4
252.1
25
Manufacture of fabricated metal products, except machinery and equipment
2.6549
93.7
92.8
99.5
100.2
95.2
107.4
104.0
102.2
110.4
94.1
97.7
102.8
103.1
26
Manufacture of computer, electronic and optical products
1.5704
130.9
146.6
146.7
124.2
115.9
115.1
126.0
139.9
165.2
126.3
129.8
134.4
136.3
27
Manufacture of electrical equipment
2.9983
131.8
127.7
128.1
125.9
121.1
163.9
131.4
122.1
144.8
125.9
132.3
143.1
152.8
28
Manufacture of machinery and equipment n.e.c.
4.7653
126.2
122.9
131.7
120.2
117.7
127.5
121.7
124.4
158.3
118.3
130.6
132.0
133.7
29
Manufacture of motor vehicles, trailers and semi-trailers
4.8573
133.5
129.2
132.6
133.4
134.4
116.0
148.3
142.0
145.3
146.7
142.7
134.0
143.2
30
Manufacture of other transport equipment
1.7763
155.0
156.4
189.0
184.5
159.4
142.2
180.0
157.8
165.2
139.2
163.1
154.2
172.8
31
Manufacture of furniture
0.1311
209.2
226.2
246.6
211.4
201.7
239.0
212.1
233.8
239.4
223.7
232.0
239.2
223.0
32
Other manufacturing
0.9415
83.3
86.9
99.5
91.8
57.0
77.9
76.6
71.5
88.2
77.2
61.4
61.7
71.4
5
Mining
14.3725
116.1
107.1
111.7
128.5
133.8
143.2
150.7
141.9
158.1
130.7
136.4
123.2
107.7
10-32
Manufacturing
77.6332
148.8
146.1
147.2
148.4
147.0
157.2
159.5
148.4
162.4
149.1
155.2
152.0
156.9
35
Electricity
7.9943
220.2
212.3
206.9
207.8
184.1
192.8
201.9
194.0
219.5
215.7
218.5
220.1
221.5
General Index
100
149.8
145.8
146.9
150.3
148.1
158.0
161.6
151.1
166.3
151.8
157.6
153.3
155.0
Note: The figures for July 2025 are provisional
- The IIP growth rate for the month of July 2025 is 3.5 percent which was 1.5 percent (Quick Estimate) in the month of June 2025.
- The growth rates of the three sectors, Mining, Manufacturing and Electricity for the month of July 2025 are (-) 7.2 percent, 5.4 percent and 0.6 percent respectively.
- The Quick Estimates of IIP stands at 155.0 against 149.8 in July 2024. The Indices of Industrial Production for the Mining, Manufacturing and Electricity sectors for the month of July 2025 stand at 107.7, 156.9 and 221.5 respectively.
- Within the manufacturing sector, 14 out of 23 industry groups at NIC 2 digit-level have recorded a positive growth in July 2025 over July 2024. The top three positive contributors for the month of July 2025 are – “Manufacture of basic metals” (12.7%), “Manufacture of electrical equipment” (15.9%) and “Manufacture of other non-metallic mineral products” (9.5%).
- In the industry group “Manufacture of basic metals”, item groups “MS slabs”, “HR coils and sheets of mild steel” and “Flat products of Alloy Steel” have shown significant contribution in growth.
- In the industry group “Manufacture of electrical equipment”, item groups “Electric heaters”, “Electrical apparatus for switching or protecting electrical circuits (e.g switchgear, circuit breakers/switches, control/ meter panel)”, and “Transformers (Small)” have shown significant contribution in growth.
- In the industry group “Manufacture of other non-metallic mineral products” item groups “Cement- all types”, “Cement Clinkers” and “Marble slab polished or not” have shown significant contribution in growth.
- As per the use base classification, the indices stand at 147.6 for Primary Goods, 119.7 for Capital Goods, 174.1 for Intermediate Goods and 201.0 for Infrastructure/ Construction Goods for the month of July 2025. Further, the indices for Consumer durables and Consumer non-durables stand at 136.3 and 147.8 respectively.
- The corresponding growth rates of IIP as per Use-based classification in July 2025 over July 2024 are (-)1.7 percent in Primary goods, 5.0 percent in Capital goods, 5.8 percent in Intermediate goods, 11.9 percent in Infrastructure/ Construction Goods, 7.7 percent in Consumer durables and 0.5 percent in Consumer non-durables (Statement III). Based on use-based classification, top three positive contributors to the growth of IIP for the month of July 2025 are Infrastructure/ construction goods, Intermediate goods and Consumer durables.
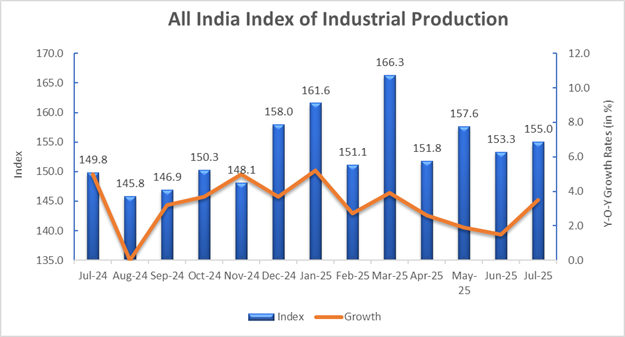
- Monthly Indices and Growth Rate (in %) of IIP for the last 13 months