Highlights of Telecom Subscription Data as on 31st May 2025
Highlights of Telecom Subscription Data as on 31st May 2025
Particulars
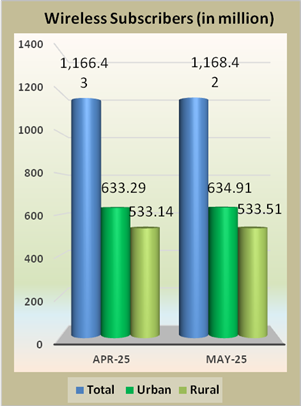
Wireless*
Wireline
Total
(Wireless+
Wireline)
Broadband Subscribers (Million)
930.77
44.09
974.87
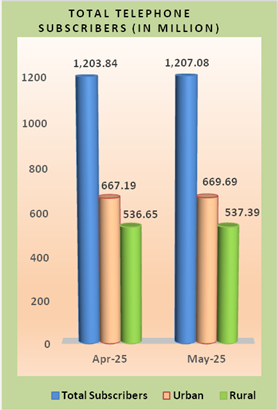
Urban Telephone Subscribers (Million)
634.91
34.78
669.69
Net Addition in May 2025 (Million)
1.61
0.88
2.50
Monthly Growth Rate
0.25%
2.60%
0.37%
Rural Telephone Subscribers (Million)
533.51
3.88
537.39
Net Addition in May 2025 (Million)
0.38
0.37
0.74
Monthly Growth Rate
0.07%
10.44%
0.14%
Total Telephone Subscribers (Million)
1168.42
38.66
1207.08
Net Addition in May, 2025 (Million)
1.99
1.25
3.24
Monthly Growth Rate
0.17%
3.34%
0.27%
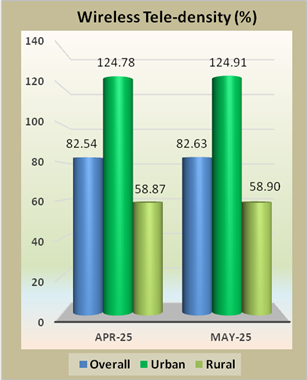
Overall Tele-density@
82.63%
2.73%
85.36%
Urban Tele-density@
124.91%
6.84%
131.76%
Rural Tele-density@
58.90%
0.43%
59.33%
Share of Urban Subscribers
54.34%
89.97%
55.48%
Share of Rural Subscribers
45.66%
10.03%
44.52%
____________________________________________________________________________________________________________________________________________________
Note:
* Wireless includes 5G FWA subscription also.
@ Based on the projection of population from the ‘Report of the Technical Group on Population Projections for India and States 2011 – 2036’.
$ VLR is acronym of Visitor Location Register. The dates of peak VLR for various telecom service providers (TSPs) are different in different service areas.
Information in this Press Release is based on the data provided by the TSPs to TRAI.
# M/s Reliance Jio Infocomm Limited has reported 1.03 million Fixed Wireless Access – Unlicensed Band Radio (FWA-UBR) subscribers in FTTx category as on 31st May 2025.
Segment–wise Broadband Subscribers and Monthly Growth Rate
in the Month of May 2025
Segment
Subscription
Subscribers
(in million)
Percent Change*
Apr-2025
May-2025
Wired Subscribers
Fixed Wired Broadband
(DSL, FTTx, Ethernet/LAN, Cable Modem, ILL)
41.41
44.09
6.46%
Wireless Subscribers
Fixed Wireless Broadband
(5G FWA, Wi-Fi, Wi-Max, Radio, Satellite)
4.87
7.79
60.06%
Mobile Broadband
(Handset/Dongle based)
896.81
922.99
2.92%
Total Broadband Subscribers
943.09
974.87
3.37%
* The report of broadband subscribers for the month of April 2025 was prepared by considering the internet subscription data for the month of November 2024 submitted by M/s Reliance Jio Infocomm Limited and M/s Bharti Airtel Limited as these service providers did not submit the internet subscription data in the prescribed format for the month of December 2024, January 2025, February 2025, March 2025 and April 2025. M/s Reliance Jio Infocomm Limited and M/s Bharti Airtel Limited have started submitting the required data in the prescribed format from the month of May 2025. For this reason, the above table depicts a significant change in the number of broadband subscribers in the month of May 2025.
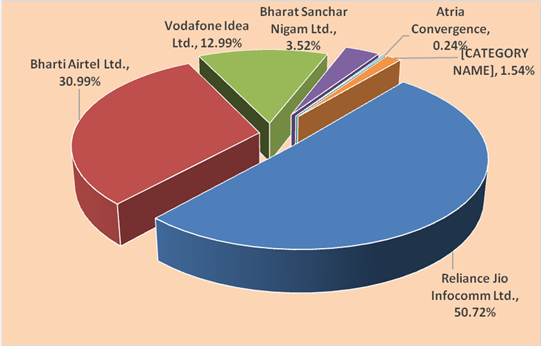
Top five Broadband
(Wired + Wireless) Service Providers as on 31st May 2025
S.N.
Name of the Service Provider
Subscriber base
(In million)
Reliance Jio Infocomm Ltd.
494.47
Bharti Airtel Ltd.
302.15
Vodafone Idea Ltd.
126.68
Bharat Sanchar Nigam Ltd.
34.32
Atria Convergence Technologies Ltd.
2.32
Market Share of Top Five Broadband (Wired+Wireless)
98.47%
Service Provider-wise Market Share of Broadband (wired + wireless) Services as on 31st May 2025
Top Five Fixed Wired Broadband Service providers as on 31st May 2025
S.N.
Name of the Service Provider
Subscriber base
(In million)
Reliance Jio Infocomm Ltd.
13.51
Bharti Airtel Ltd.
9.26
Bharat Sanchar Nigam Ltd
4.32
Atria Convergence Technologies Ltd.
2.32
Kerala Vision Broadband Ltd.
1.34
Market Share of Top Five Fixed Wired Broadband Service Providers
69.74%
Top five Wireless Broadband (Fixed Wireless Broadband + Mobile Broadband)
Service providers as on 31st May 2025,
S.N.
Name of the Service Provider
Subscriber base
(In million)
Reliance Jio Infocomm Ltd.
480.96
Bharti Airtel Ltd.
292.89
Vodafone Idea Ltd.
126.67
Bharat Sanchar Nigam Ltd..
29.99
IBus Virtual Network Services Private Limited
0.09
Market Share of Top Five Wireless Broadband Service Providers
99.98%
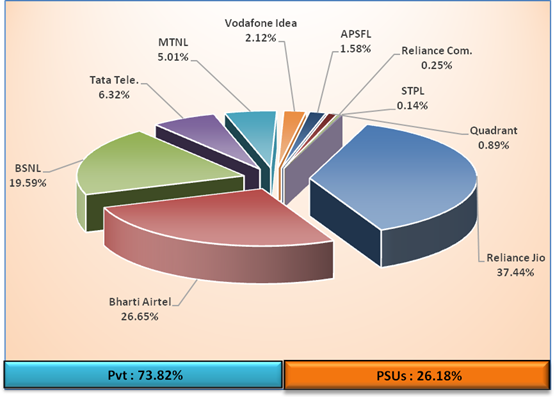
Access Service Provider-wise Market Share of Wireline Subscribers
as on 31st May 2025
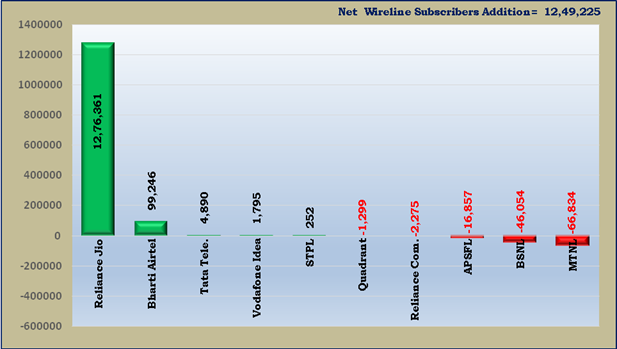
Access Service Provider wise Net Addition/Decline in Wireline Subscribers During the Month of May 2025
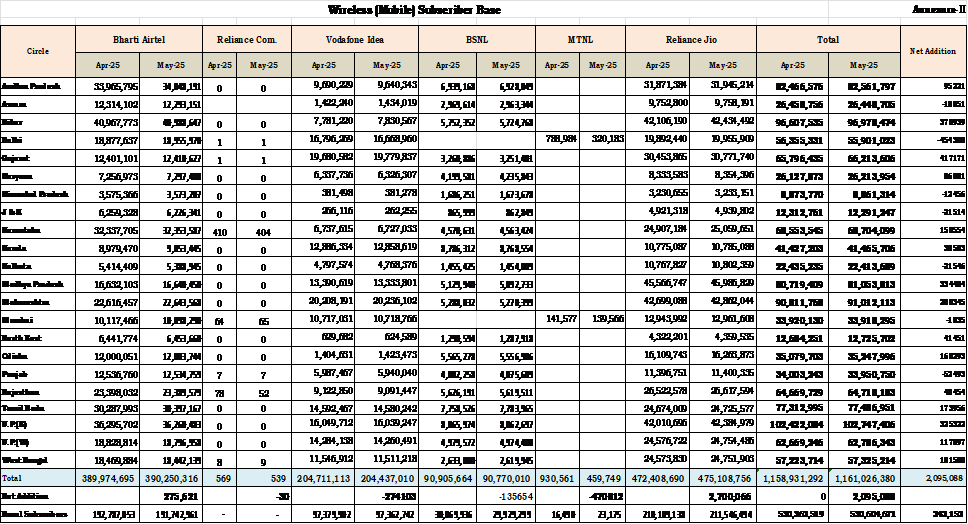
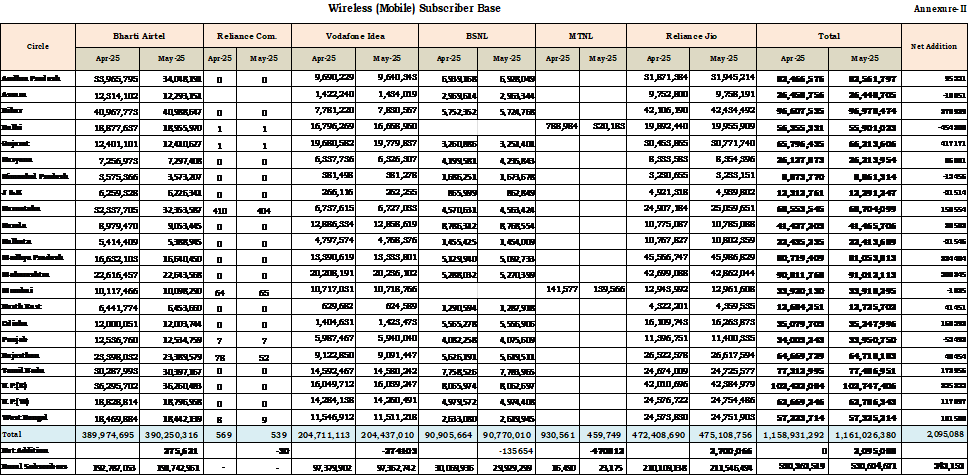
(A) Wireless (Mobile) Subscriber Base
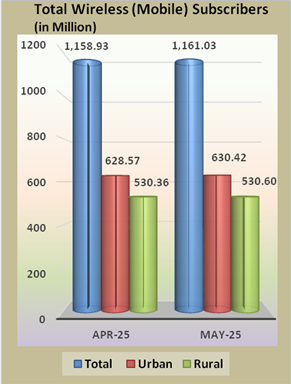
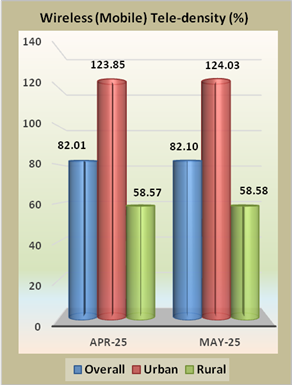
The wireless (mobile) tele-density in India increased from 82.01% at the end of April 2025 to 82.10% at the end of May 2025. The urban wireless tele-density increased from 123.85% at the end of April 2025 to 124.03% at the end of May 2025 and rural tele-density increased from 58.57% to 58.58% during the same period. The share of urban and rural wireless (mobile) subscribers in total number of wireless (mobile) subscribers was 54.30% and 45.70% respectively at the end of May 2025.
Detailed statistics of wireless (mobile) subscriber base is available at Annexure-II.
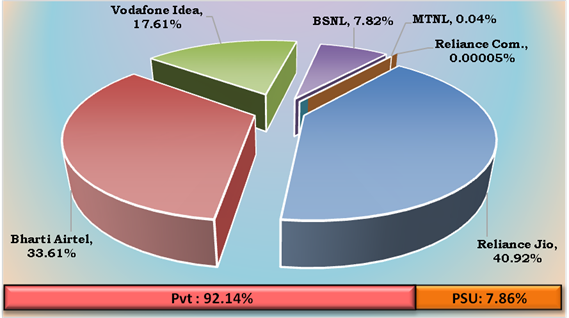
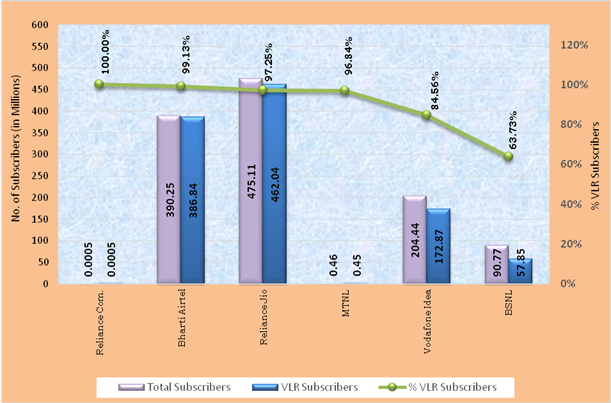
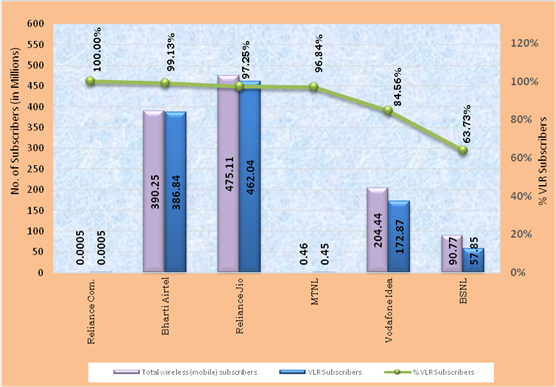
• As on 31st May 2025, the private access service providers held 92.14% market share of the wireless (mobile) subscriber base, whereas BSNL and MTNL, the two PSU access service providers, had a market share of 7.86%.
Access Service Provider-wise Market Shares of Wireless (Mobile) Subscribers as on 31st May 2025
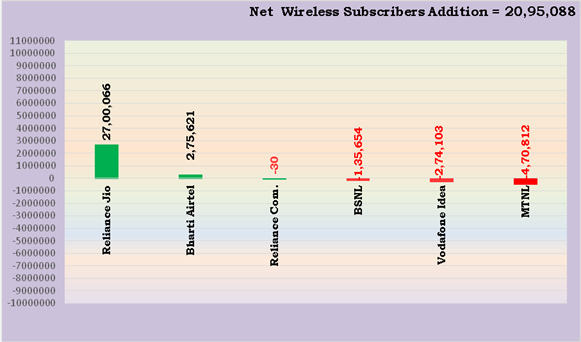
Net Addition/ Decline in Wireless (Mobile) Subscribers of
Access Service Providers in the month of May 2025
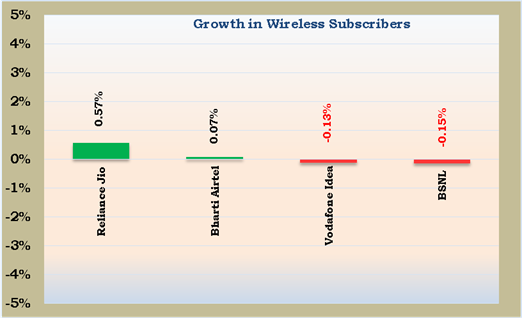
Growth in Wireless (Mobile) Subscribers
Major Access Service Provider-wise Monthly Growth/ Decline Rate of Wireless Subscribers in the month of May 2025
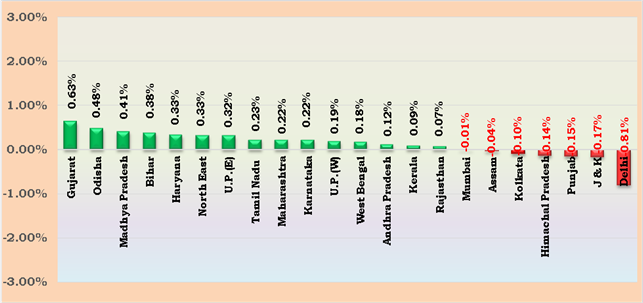
Service Area-wise Monthly Growth/ Decline Rate of Wireless (Mobile) Subscribers in the month of May 2025
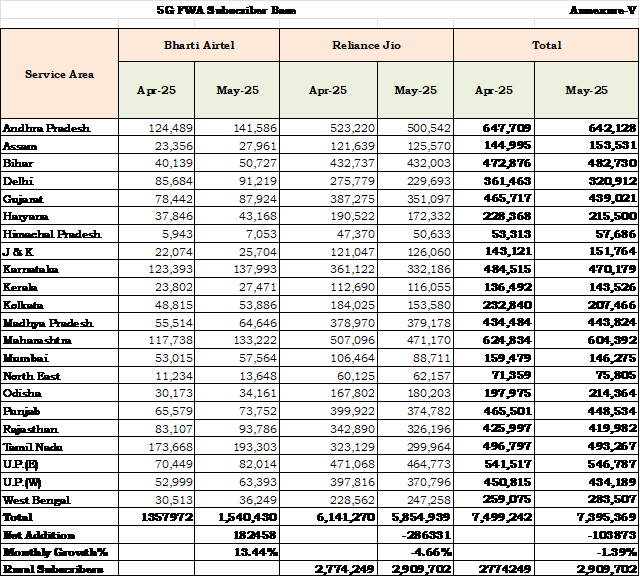
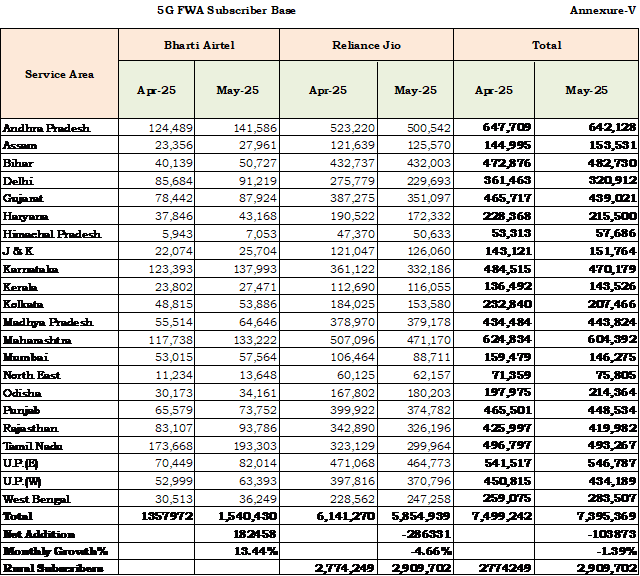
(B) Wireless (5G FWA) Subscriber Base
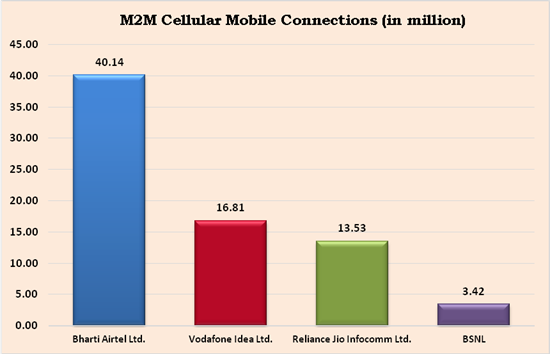
The number of M2M cellular mobile connections increased from 69.87 million at the end of April 2025 to 73.91 million at the end of May 2025.
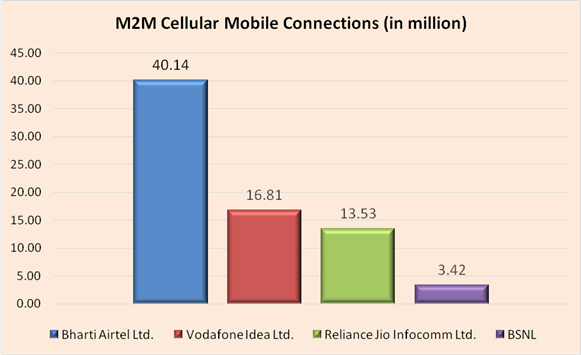
Bharti Airtel Limited has the highest number of M2M cellular mobile connections of 40.14 million with a market share of 54.31%, followed by Vodafone idea Limited, Reliance Jio Infocom Limited and BSNL with market share of 22.74%, 18.31% and 4.63% respectively.
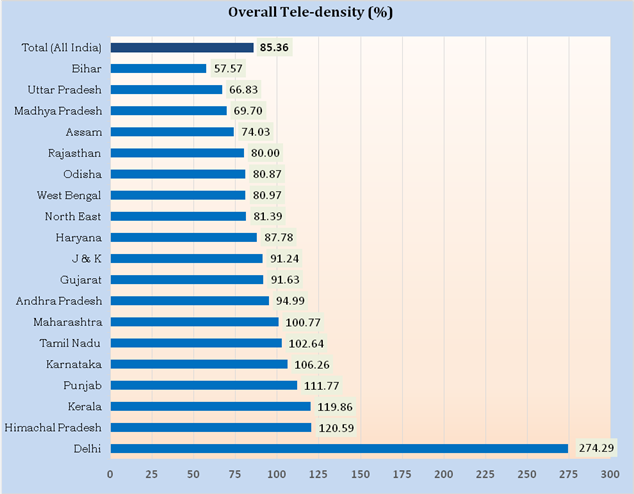
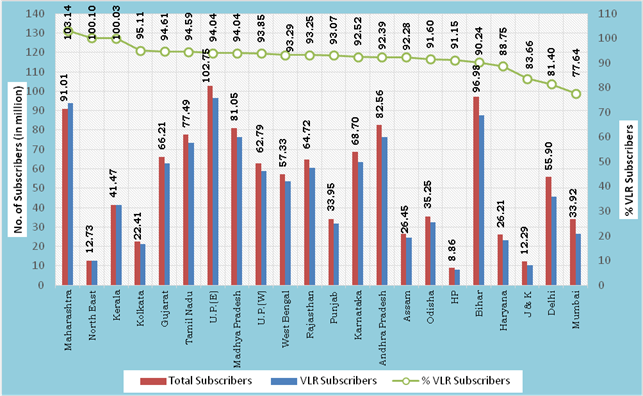
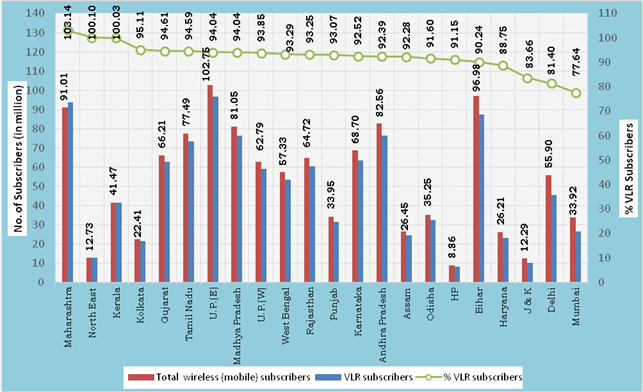
Overall Tele-density (LSA Wise) as on 31st May 2025
Notes: –
Circle Category-wise Net Additions in Telephone Subscribers in the Month of May 2025
Circle
Category
Net additions in the month of May 2025
Telephone Subscriber base as on 31st May 2025
Wireline segment
Wireless* segment
Wireline segment
Wireless* segment
Circle A
461,410
966,662
15,152,689
388,627,553
Circle B
518,781
992,468
10,845,406
473,197,218
Circle C
153,940
588,903
3,158,931
193,689,318
Metro
115,094
-556,818
9,503,153
112,907,660
All India
1,249,225
1,991,215
38,660,179
1,168,421,749
*Wireless includes 5G FWA subscription also.
Circle Category-wise Monthly and Yearly Growth Rates in Telephone Subscribers in the month of May 2025
Circle Category
Monthly growth rate (%)
(April-25 to May-25)
Yearly growth rate (%)
(May-24 to May-25)
Wireline Segment
Wireless* Segment
Wireline Segment
Wireless* Segment
Circle A
3.14%
0.25%
12.04%
-0.02%
Circle B
5.02%
0.21%
15.95%
-0.47%
Circle C
5.12%
0.30%
14.39%
1.80%
Metro
1.23%
-0.49%
4.50%
-1.44%
All India
3.34%
0.17%
11.31%
-0.05%
*Wireless includes 5G FWA subscription also.
Note: Circle Category-Metro includes Delhi, Mumbai and Kolkata.
Access Service Provider-wise Percentage of VLR Subscribers
in the Month of May 2025
Service Area-wise Percentage of VLR Subscribers
in the Month of May 2025
Service Area Wise MNP Status
Zone-I
Zone–II
Service Area
Cumulative Number of Porting Requests Till (in Million)
Service Area
Cumulative Number of Porting Requests Till
(in Million)
Apr-25
May-25
Apr-25
May-25
Delhi
53.87
54.53
Andhra Pradesh
73.33
73.98
Gujarat
77.03
77.92
Assam
8.30
8.42
Haryana
35.58
35.99
Bihar
65.97
67.13
Himachal Pradesh
4.74
4.79
Karnataka
74.10
74.69
Jammu & Kashmir
3.30
3.38
Kerala
26.58
26.84
Maharashtra
91.80
92.72
Kolkata
20.36
20.55
Mumbai
36.50
36.74
Madhya Pradesh
89.58
90.83
Punjab
36.72
37.08
North East
2.58
2.61
Rajasthan
75.23
75.99
Odisha
19.70
19.93
U.P.(East)
113.81
115.77
Tamil Nadu
69.96
70.59
U.P.(West)
85.44
86.90
West Bengal
67.93
69.08
Total
614.03
621.81
Total
518.38
524.64
Total (Zone-I + Zone-II)
1,132.41
1,146.45
Net Addition (May 2025)
14.03 million
Contact details in case of any clarification: –
Shri Akhilesh Kumar Trivedi, Advisor (NSL-II),
Telecom Regulatory Authority of India
World Trade Centre, Tower-F,
Nauroji Nagar, New Delhi – 110029
Ph: 011-20907758 (Pushpendra Kumar Singh)
E-mail: advmn@trai.gov.in I/C Pr. Advisor (NSL), TRAI
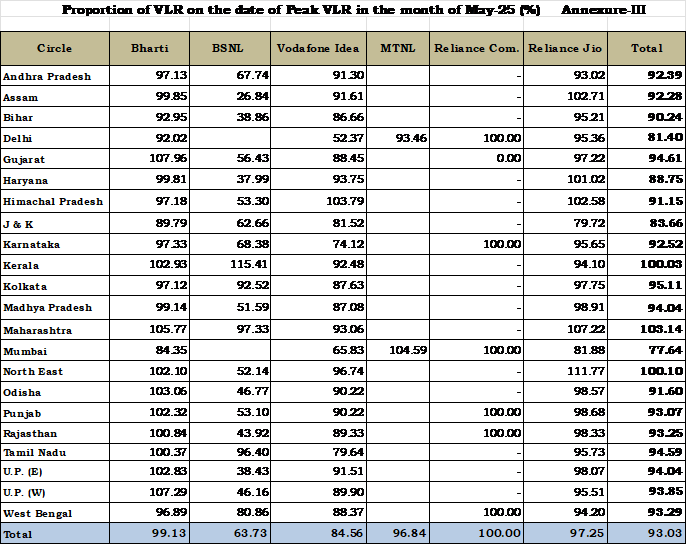
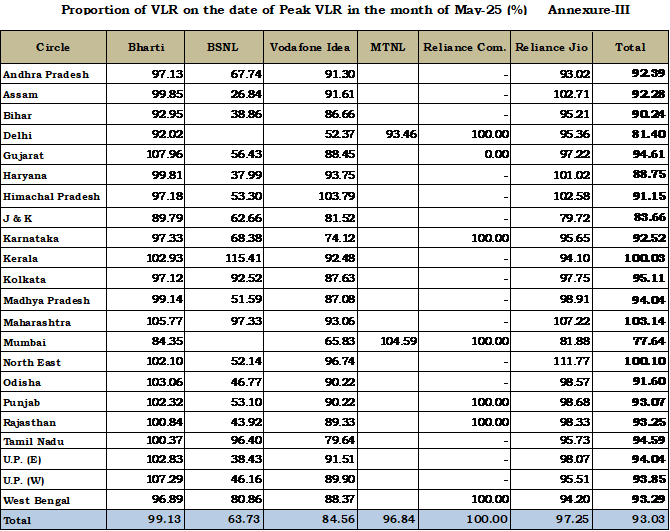
Note: Peak VLR figures in some circles of some of the service providers are more than their HLR figures due to a large number of inroamers.
Annexure IV
VLR Subscribers in the Wireless Segment
Home Location Register (HLR) is a central database that contains details of each mobile phone subscriber that is authorized to use the GSM core network. The HLRs store details of every SIM card issued by the service provider. Each SIM has a unique identifier called an International Mobile Subscriber Identity (IMSI), which is the primary key to each HLR record. The HLR data is stored for as long as a subscriber remains with the service provider. HLR also manages the mobility of subscribers by means of updating their position in administrative areas. It sends the subscriber data to a Visitor Location Register (VLR).
Subscriber numbers reported by the service providers is the difference between the numbers of IMSI registered in service provider’s HLR and sum of other figures as given below: –
1
Total IMSI’s in HLR (A)
2
Less: (B = a + b + c + d + e)
a.
Test/Service Cards
b.
Employees
c.
Stock in hand/in Distribution Channels (Active Card)
d.
Subscriber Retention period expired
e.
Service suspended pending disconnection
3
Subscribers Base (A-B)
Visitor Location Register (VLR) is a temporary database of the subscribers who have roamed into the particular area, which it serves. Each base station in the network is served by exactly one VLR; hence a subscriber cannot be present in more than one VLR at a time.
If subscriber is in active stage i.e. he is able to send/receive calls/SMSs he is available both in HLR and VLR. However, it may be possible that the subscriber is registered in HLR but not in VLR due to the reason that he is either switched-off or moved out of coverage area, not reachable etc. In such circumstances he will be available in HLR but not in VLR. This causes difference between subscriber number reported by the service providers based on HLR and numbers available in VLR.
The VLR subscriber data calculated here is based on active subscribers in VLR on the date of Peak subscriber number in VLR of the particular month for which the data is being collected. This data is to be taken from the switches having the purge time of not more than 72 hours.
- Broadband Subscriber Base