Posting a growth rate of 12% Y-o-Y, ₹14.97 lakh crore gross GST collection during April-December 2023 period
Posting a growth rate of 12% Y-o-Y, ₹14.97 lakh crore gross GST collection during April-December 2023 period
During the April-December 2023 period, gross GST collection witnessed a robust 12% y-o-y growth, reaching ₹14.97 lakh crore, as against ₹13.40 lakh crore collected in the same period of the previous year (April-December 2022).
The average monthly gross GST collection of ₹1.66 lakh crore in the first 9-month period this year represents a 12% increase compared to the ₹1.49 lakh crore average recorded in the corresponding period of FY23.
The gross GST revenue collected in the month of December, 2023 is ₹1,64,882 crore out of which CGST is ₹30,443 crore, SGST is ₹37,935 crore, IGST is ₹84,255 crore (including ₹41,534 crore collected on import of goods) and cess is ₹12,249 crore (including ₹1,079 crore collected on import of goods). Notably, this marks the seventh month so far this year with collections exceeding ₹1.60 lakh crore.
The government has settled ₹40,057 crore to CGST and ₹33,652 crore to SGST from IGST. The total revenue of Centre and the States in the month of December, 2023 after regular settlement is ₹70,501 crore for CGST and ₹71,587 crore for the SGST.
The revenues for the month of December, 2023 are 10.3% higher than the GST revenues in the same month last year. During the month, the revenues from domestic transactions (including import of services) are 13% higher than the revenues from these sources during the same month last year.
The chart below shows trends in monthly gross GST revenues during the current year. Table-1 shows the state-wise figures of GST collected in each State during the month of December 2023 as compared to December 2022. Table-2 shows the state-wise figures of post settlement GST revenue of each State till the month of December 2023.
Chart: Trends in GST Collection
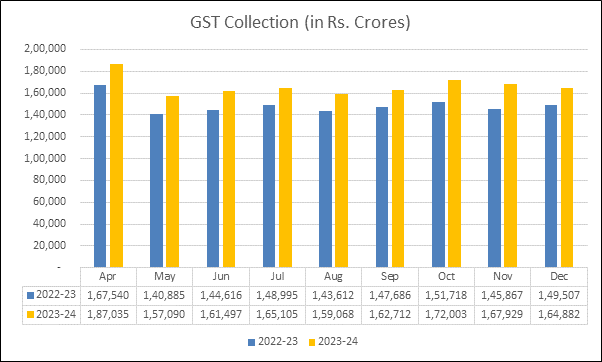
Table -1: State-wise growth of GST Revenues during December, 2023
State/UT
Dec-22
Dec-23
Growth (%)
Jammu and Kashmir
410
492
20%
Himachal Pradesh
708
745
5%
Punjab
1,734
1,875
8%
Chandigarh
218
281
29%
Uttarakhand
1,253
1,470
17%
Haryana
6,678
8,130
22%
Delhi
4,401
5,121
16%
Rajasthan
3,789
3,828
1%
Uttar Pradesh
7,178
8,011
12%
Bihar
1,309
1,487
14%
Sikkim
290
254
-13%
Arunachal Pradesh
67
97
44%
Nagaland
44
46
4%
Manipur
46
50
9%
Mizoram
23
27
18%
Tripura
78
79
2%
Meghalaya
171
171
0%
Assam
1,150
1,303
13%
West Bengal
4,583
5,019
10%
Jharkhand
2,536
2,632
4%
Odisha
3,854
4,351
13%
Chhattisgarh
2,585
2,613
1%
Madhya Pradesh
3,079
3,423
11%
Gujarat
9,238
9,874
7%
Dadra and Nagar Haveli and Daman & Diu
318
333
5%
Maharashtra
23,598
26,814
14%
Karnataka
10,061
11,759
17%
Goa
460
553
20%
Lakshadweep
1
4
310%
Kerala
2,185
2,458
12%
Tamil Nadu
8,324
9,888
19%
Puducherry
192
232
21%
Andaman and Nicobar Islands
21
28
35%
Telangana
4,178
4,753
14%
Andhra Pradesh
3,182
3,545
11%
Ladakh
26
58
127%
Other Territory
249
227
-9%
Center Jurisdiction
179
243
36%
Grand Total
1,08,394
1,22,270
13%
Table-2: SGST & SGST portion of IGST settled to States/UTs
April-December (Rs. in crore)
Pre-Settlement SGST
Post-Settlement SGST[2]
State/UT
2022-23
2023-24
Growth
2022-23
2023-24
Growth
Jammu and Kashmir
1,699
2,188
29%
5,442
6,021
11%
Himachal Pradesh
1,731
1,929
11%
4,205
4,160
-1%
Punjab
5,719
6,280
10%
14,371
16,382
14%
Chandigarh
451
495
10%
1,582
1,708
8%
Uttarakhand
3,568
4,046
13%
5,758
6,288
9%
Haryana
13,424
14,992
12%
23,134
25,733
11%
Delhi
10,167
11,544
14%
21,426
23,611
10%
Rajasthan
11,483
12,732
11%
25,903
28,794
11%
Uttar Pradesh
20,098
24,164
20%
49,384
55,656
13%
Bihar
5,307
6,067
14%
17,360
19,157
10%
Sikkim
221
341
54%
623
738
18%
Arunachal Pradesh
344
464
35%
1,176
1,418
21%
Nagaland
158
226
43%
716
781
9%
Manipur
216
254
18%
1,046
813
-22%
Mizoram
130
197
51%
623
707
14%
Tripura
311
375
21%
1,074
1,166
9%
Meghalaya
339
438
29%
1,087
1,244
14%
Assam
3,785
4,346
15%
9,280
10,727
16%
West Bengal
15,959
17,428
9%
29,170
31,300
7%
Jharkhand
5,562
6,545
18%
8,237
9,148
11%
Odisha
10,313
11,903
15%
14,046
18,093
29%
Chhattisgarh
5,426
6,004
11%
8,370
9,937
19%
Madhya Pradesh
7,890
9,606
22%
20,834
24,026
15%
Gujarat
27,820
31,028
12%
42,354
46,624
10%
Dadra and Nagar Haveli and Daman and Diu
479
481
0%
889
804
-10%
Maharashtra
63,169
74,589
18%
95,981
1,08,887
13%
Karnataka
25,976
30,070
16%
48,642
54,881
13%
Goa
1,435
1,685
17%
2,606
2,951
13%
Lakshadweep
7
17
153%
22
72
222%
Kerala
9,011
10,293
14%
21,953
23,045
5%
Tamil Nadu
26,657
30,329
14%
43,332
47,960
11%
Puducherry
344
371
8%
876
1,037
18%
Andaman and Nicobar Islands
133
155
16%
365
388
7%
Telangana
12,287
14,579
19%
27,964
29,889
7%
Andhra Pradesh
9,298
10,407
12%
21,137
23,481
11%
Ladakh
123
186
51%
420
523
25%
Other Territory
135
182
35%
420
903
115%
Grand Total
3,01,175
3,46,938
15%
5,71,807
6,39,052
12%