Highlights of Telecom Subscription Data as on 31st August, 2024
Highlights of Telecom Subscription Data as on 31st August, 2024
Particulars
Wireless
Wireline
Total
(Wireless+
Wireline)
Broadband Subscribers (Million)
906.37
42.84
949.21
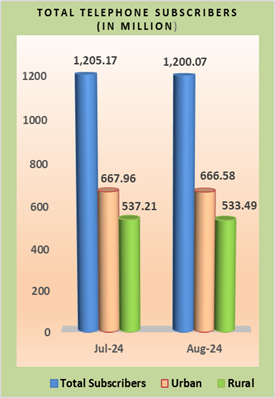
Urban Telephone Subscribers (Million)
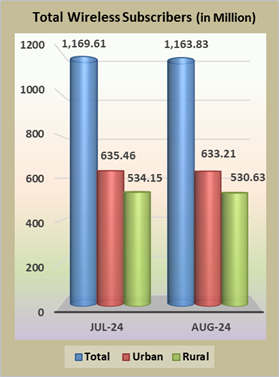
633.21
33.37
666.58
Net Addition in August, 2024 (Million)
-2.25
0.87
-1.38
Monthly Growth Rate
-0.35%
2.68%
-0.21%
Rural Telephone Subscribers (Million)
530.63
2.86
533.49
Net Addition in August, 2024 (Million)
-3.52
-0.20
-3.72
Monthly Growth Rate
-0.66%
-6.47%
-0.69%
Total Telephone Subscribers (Million)
1163.83
36.23
1200.07
Net Addition in August, 2024 (Million)
-5.77
0.67
-5.10
Monthly Growth Rate
-0.49%
1.90%
-0.42%
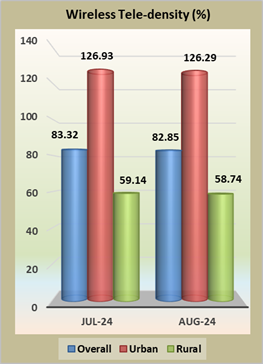
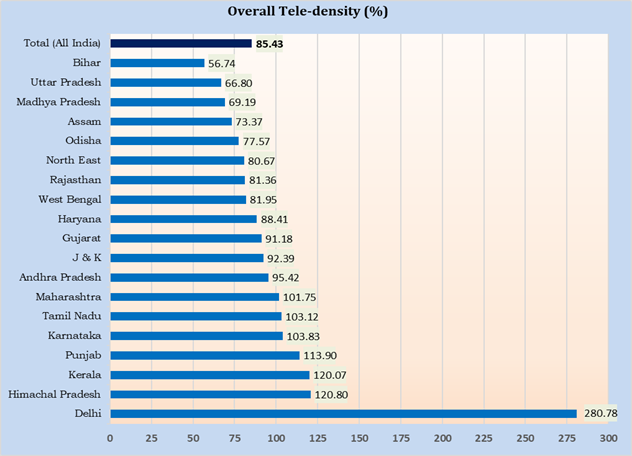
Overall Tele-density*(%)
82.85%
2.58%
85.43%
Urban Tele-density*(%)
126.29%
6.66%
132.94%
Rural Tele-density*(%)
58.74%
0.32%
59.05%
Share of Urban Subscribers
54.41%
92.09%
55.54%
Share of Rural Subscribers
45.59%
7.91%
44.46%
____________________________________________________________________________________________________________________________________________________________
Note:
– Information in this Press Release is based on the data provided by the Service Providers
* Based on the projection of population from the ‘Report of the Technical Group on Population Projections for India and States 2011 – 2036’, which is available under the link https://main.mohfw.gov.in/sites/default/files/Population%20Projection%20Report%202011-2036%20-%20upload_compressed_0.pdf
# VLR is acronym of Visitor Location Register. The dates of peak VLR for various TSPs are different in different service areas.
Segment–wise Broadband Subscribers and Monthly Growth Rate in the month of August, 2024
Segment
Broadband subscribers
(in million)
Monthly growth rate in the month of August, 2024
As on 31st July 2024
As on 31st August 2024
Wired subscribers
41.98
42.84
2.06%
Fixed Wireless subscribers
(Wi-Fi, Wi-Max, Point-to-Point Radio & VSAT)
0.83
0.91
9.39%
Mobile devices users (Phones and dongles)
903.38
905.46
0.23%
Total
946.19
949.21
0.32%
As on 31st August, 2024, top five Broadband
(Wired+Wireless) Service providers
S.No.
Name of the Service Provider
Subscriber base
(In million)
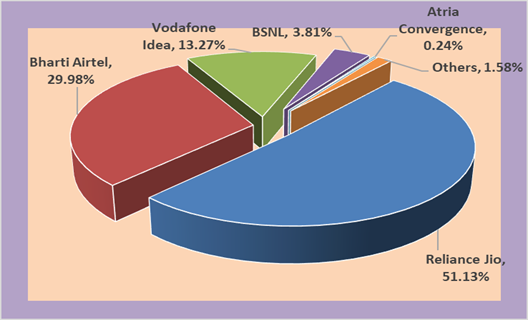
Reliance Jio Infocomm Ltd
485.29
Bharti Airtel Ltd.
284.55
Vodafone Idea Ltd.
125.92
Bharat Sanchar Nigam Ltd.
36.20
Atria Convergence Technologies Limited
2.27
Market Share of Top Five Vs Total Broadband (Wired+Wireless)
98.42%
Service Provider-wise Market Share of Broadband
(wired + wireless) Services as on 31st August, 2024
As on 31st August, 2024, top five Wired Broadband Service providers
S.No.
Name of the Service Provider
Subscriber base
(In million)
Reliance Jio Infocomm Ltd
13.54
Bharti Airtel Ltd.
8.29
Bharat Sanchar Nigam Ltd.
4.20
Atria Convergence Technologies Limited
2.27
Kerala Vision Broadband Ltd.
1.20
Market Share of Top Five Vs Total Wired Broadband
68.83%
As on 31st August, 2024, top five Wireless Broadband Service providers
S.No.
Name of the Service Provider
Subscriber base
(In million)
Reliance Jio Infocomm Ltd.
471.75
Bharti Airtel Ltd.
276.26
Vodafone Idea Ltd.
125.92
Bharat Sanchar Nigam Ltd.
32
Intech Online Pvt. Ltd.
0.25
Market Share of Top Five Vs Total Wireless Broadband
99.98%
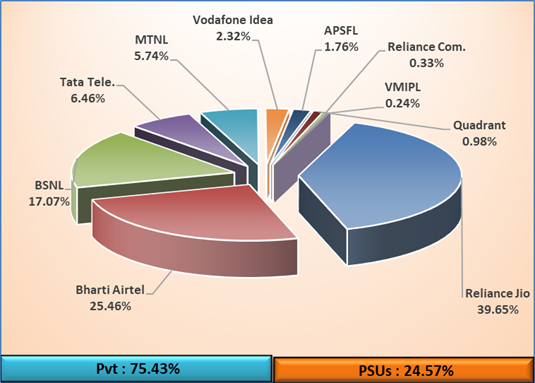
Access Service Provider-wise Market Share of Wireline Subscribers
as on 31st August, 2024
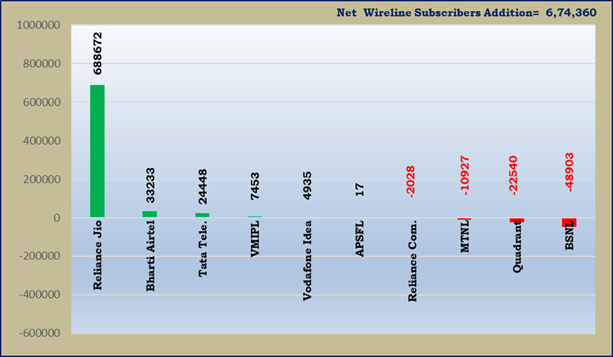
Access Service Provider-wise Net Addition/Decline in Wireline Subscribers during the month of August, 2024
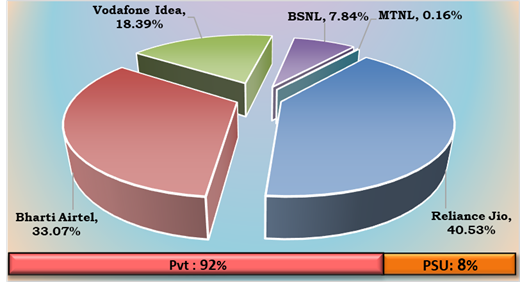
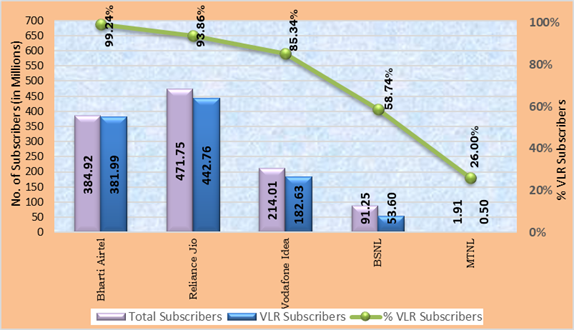
• As on 31st August, 2024, the private access service providers held 92% market share of the wireless subscribers whereas BSNL and MTNL, the two PSU access service providers, had a market share of only 8%.
Access Service Provider-wise Market Shares in term of Wireless Subscribers as on 31st August, 2024
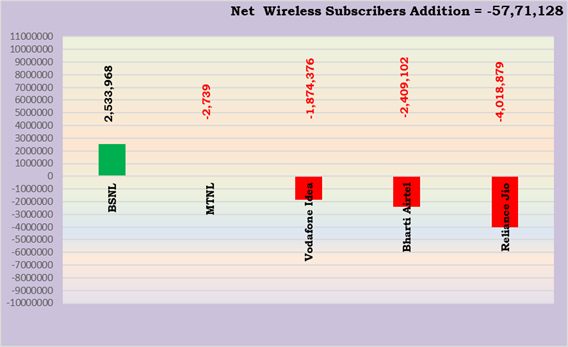
Net Addition in Wireless Subscribers of Access Service Providers in the month of August, 2024
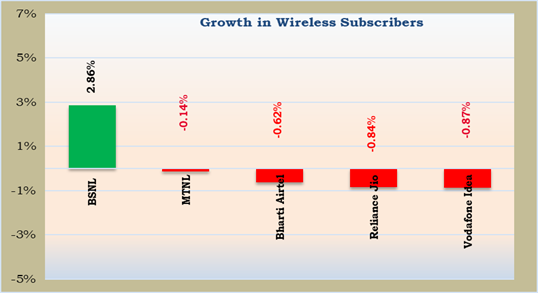
Growth in Wireless Subscribers
Access Service Provider-wise Monthly Growth Rate of Wireless Subscribers in the month of August, 2024
Note: BSNL includes its Virtual Network Operator (VNO).
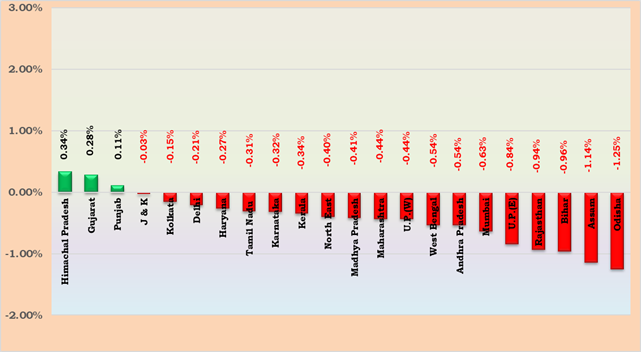
Service Area-wise Monthly Growth Rate of Wireless Subscribers in the month of August, 2024
M2M cellular mobile connections
Number of M2M cellular mobile connections increased from 53.67 million at the end of July, 24, to 54.07 million at the end of August, 24.
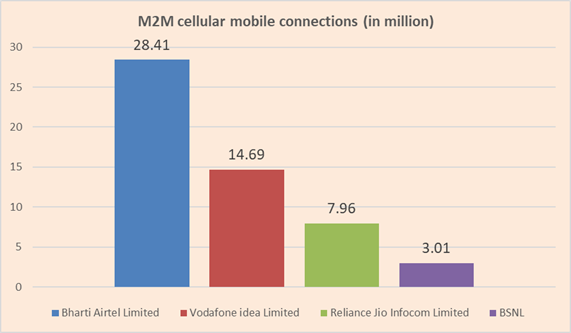
Bharti Airtel Limited has the highest number of M2M cellular mobile connections 28.41 million with a market share of 52.54% followed by Vodafone idea Limited, Reliance Jio Infocom Limited and BSNL with market share of 27.18%, 14.72% and 5.56% respectively.
Overall Tele-density (LSA Wise) – As on 31st August, 2024
Notes: –
Circle Category-wise Net Additions in Telephone Subscribers in the month of August, 2024
Circle
Category
Net additions in the month of August, 2024
Telephone Subscriber base as on 31st August, 2024
Wireline segment
Wireless segment
Wireline segment
Wireless segment
Circle A
248906
-1132270
14055442
387651400
Circle B
243317
-2592258
9921102
472634280
Circle C
93194
-1677685
2982528
189340879
Metro
88943
-368915
9275383
114208245
All India
674360
-5771128
36234455
1163834804
Circle Category-wise monthly and yearly Growth Rates in Telephone Subscribers in the month of August, 2024
Circle Category
Monthly growth rate (%)
(July-24 to Augusgt-24)
Yearly growth rate (%)
(August-23 to August-24)
Wireline Segment
Wireless Segment
Wireline Segment
Wireless Segment
Circle A
1.80%
-0.29%
16.83%
0.74%
Circle B
2.51%
-0.55%
27.17%
1.50%
Circle C
3.23%
-0.88%
32.22%
2.22%
Metro
0.97%
-0.32%
6.75%
1.30%
All India
1.90%
-0.49%
17.73%
1.34%
Note: Circle Category-Metro includes Delhi, Mumbai and Kolkata. Data for Chennai has been included in Circle Category-A, as part of TamilNadu.
Access Service Provider-wise Percentage of VLR Subscribers
in the month of August, 2024
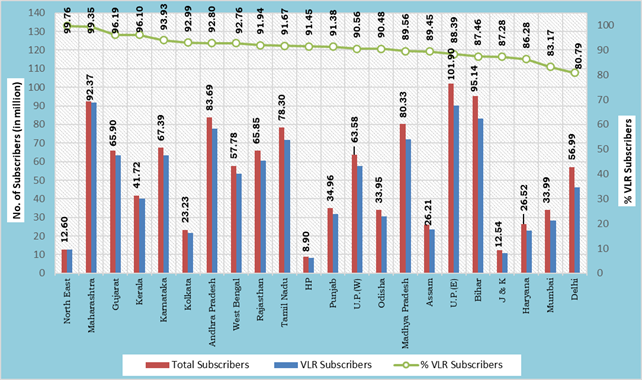
Service Area wise percentage of VLR Subscribers
in the month of August, 2024
Service Area Wise MNP Status
Zone-I
Zone–II
Service Area
Number of Porting Requests (in Million)
Service Area
Number of Porting Requests
(in Million)
Jul-24
Aug-24
Jul-24
Aug-24
Delhi
48.50
49.08
Andhra Pradesh
67.39
68.18
Gujarat
68.81
69.80
Assam
7.35
7.48
Haryana
31.98
32.42
Bihar
56.75
57.81
Himachal Pradesh
4.31
4.37
Karnataka
69.00
69.67
Jammu & Kashmir
2.71
2.79
Kerala
24.32
24.63
Maharashtra
82.76
83.95
Kolkata
18.63
18.86
Mumbai
34.08
34.35
Madhya Pradesh
78.58
79.85
Punjab
33.63
34.03
North East
2.34
2.37
Rajasthan
68.94
69.75
Odisha
17.82
18.05
U.P.(East)
96.80
98.73
Tamil Nadu
64.36
65.11
U.P.(West)
73.42
74.83
West Bengal
58.65
59.68
Total
545.93
554.09
Total
465.19
471.69
Total (Zone-I + Zone-II)
1,011.13
1,025.78
Net Addition (August, 2024)
14.66 million
Contact details in case of any clarification: –
Shri Amit Sharma, Advisor (F&EA),
Telecom Regulatory Authority of India
World Trade Centre, Tower-F,
Nauroji Nagar, New Delhi – 110029
Ph: 011-20907772 (Atul Kumar Chaudhary)
E-mail: advfea2@trai.gov.in Secretary, TRAI
Note: Peak VLR figures in some circles of some of the service providers are more than their HLR figures due to a large number of inroamers.
Annexure IV
VLR Subscribers in the Wireless Segment
Home Location Register (HLR) is a central database that contains details of each mobile phone subscriber that is authorized to use the GSM core network. The HLRs store details of every SIM card issued by the service provider. Each SIM has a unique identifier called an International Mobile Subscriber Identity (IMSI), which is the primary key to each HLR record. The HLR data is stored for as long as a subscriber remains with the service provider. HLR also manages the mobility of subscribers by means of updating their position in administrative areas. It sends the subscriber data to a Visitor Location Register (VLR).
Subscriber numbers reported by the service providers is the difference between the numbers of IMSI registered in service provider’s HLR and sum of other figures as given below: –
1
Total IMSI’s in HLR (A)
2
Less: (B = a + b + c + d + e)
a.
Test/Service Cards
b.
Employees
c.
Stock in hand/in Distribution Channels (Active Card)
d.
Subscriber Retention period expired
e.
Service suspended pending disconnection
3
Subscribers Base (A-B)
Visitor Location Register (VLR) is a temporary database of the subscribers who have roamed into the particular area, which it serves. Each base station in the network is served by exactly one VLR; hence a subscriber cannot be present in more than one VLR at a time.
If subscriber is in active stage i.e. he is able to send/receive calls/SMSs he is available both in HLR and VLR. However, it may be possible that the subscriber is registered in HLR but not in VLR due to the reason that he is either switched-off or moved out of coverage area, not reachable etc. In such circumstances he will be available in HLR but not in VLR. This causes difference between subscriber number reported by the service providers based on HLR and numbers available in VLR.
The VLR subscriber data calculated here is based on active subscribers in VLR on the date of Peak subscriber number in VLR of the particular month for which the data is being collected. This data is to be taken from the switches having the purge time of not more than 72 hours.
- Broadband Subscriber