India’s total exports estimated to grow at 2.81% in July 2024.The cumulative overall exports during April-July 2024 estimated to grow at 6.65%.
India’s total exports estimated to grow at 2.81% in July 2024.The cumulative overall exports during April-July 2024 estimated to grow at 6.65%.
July 2024
April-July 2024
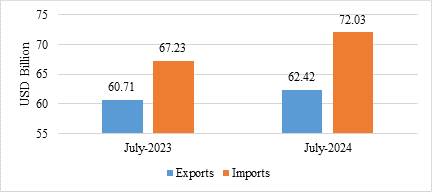
India’s total exports (Merchandise and Services combined) for July 2024* is estimated at USD 62.42 Billion, registering a positive growth of 2.81 percent vis-à-vis July 2023.Total imports (Merchandise and Services combined) for July 2024* is estimated at USD 72.03 Billion, registering a positive growth of 7.14 percent vis-à-vis July 2023.
Table 1: Trade during July 2024*
July 2024
(USD Billion)
July 2023
(USD Billion)
Merchandise
Exports
33.98
34.49
Imports
57.48
53.49
Services*
Exports
28.43
26.22
Imports
14.55
13.74
Total Trade
(Merchandise +Services) *
Exports
62.42
60.71
Imports
72.03
67.23
Trade Balance
-9.61
-6.52
* Note: The latest data for services sector released by RBI is for June2024. The data for July 2024 is an estimation, which will be revised based on RBI’s subsequent release.
Fig 1: Total Trade during July2024*
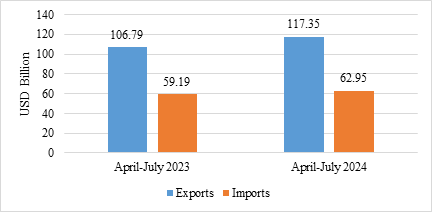
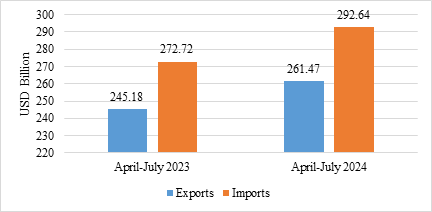
India’s total exports during April-July2024* is estimated at USD 261.47 Billion registering a positive growth of 6.65 percent. Total imports during April-July 2024* is estimated at USD 292.64 Billion registering a growth of 7.30 percent.
Table 2: Trade during April-July 2024*
April-July 2024
(USD Billion)
April-July 2023
(USD Billion)
Merchandise
Exports
144.12
138.39
Imports
229.70
213.53
Services*
Exports
117.35
106.79
Imports
62.95
59.19
Total Trade
(Merchandise +Services) *
Exports
261.47
245.18
Imports
292.64
272.72
Trade Balance
-31.17
-27.55
Fig 2: Total Trade during April-July 2024*
MERCHANDISE TRADE
Fig 3: Merchandise Trade during July 2024
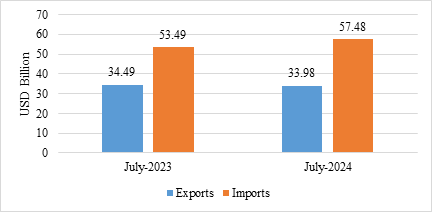
Fig4: Merchandise Trade during April-July 2024
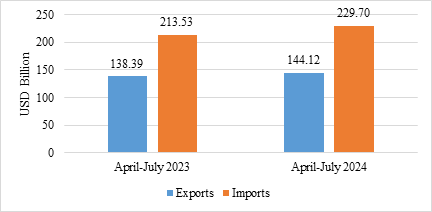
Table 3: Trade excluding Petroleum and Gems & Jewellery during July 2024
(USD Billion)
July 2023
(USD Billion)
Non- petroleum exports
28.75
27.77
Non- petroleum imports
43.61
41.67
Non-petroleum & Non-Gems & Jewellery exports
26.92
25.47
Non-petroleum & Non-Gems & Jewellery imports
38.98
36.16
Note: Gems & Jewellery Imports include Gold, Silver & Pearls, precious & Semi-precious stones
Fig 5: Trade excluding Petroleum and Gems & Jewellery during July 2024
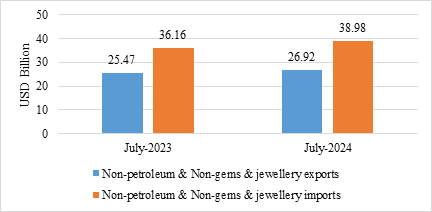
Table 4: Trade excluding Petroleum and Gems & Jewellery during April-July 2024
(USD Billion)
April-July 2023
(USD Billion)
Non- petroleum exports
118.19
112.64
Non- petroleum imports
164.33
159.87
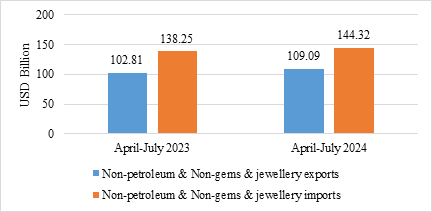
Non-petroleum &Non Gems& Jewellery exports
109.09
102.81
Non-petroleum & Non Gems & Jewellery imports
144.32
138.25
Note: Gems & Jewellery Imports include Gold, Silver & Pearls, precious & Semi-precious stones
Fig 6: Trade excluding Petroleum and Gems & Jewellery during April-July 2024
SERVICES TRADE
Fig 7: Services Trade during July2024*
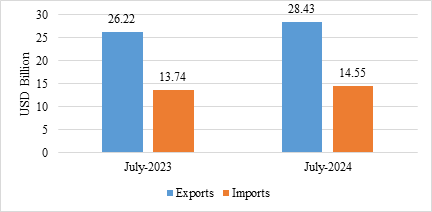
Fig 8: Services Trade during April-July 2024*