INDIA’S IIP RECORDS A GROWTH OF 5.0% IN THE FIRST MONTH OF THE FINANCIAL YEAR 2024-25
INDIA’S IIP RECORDS A GROWTH OF 5.0% IN THE FIRST MONTH OF THE FINANCIAL YEAR 2024-25
The Quick Estimates of Index of Industrial Production (IIP) are released on 12th of every month (or previous working day if 12th is a holiday) with a six weeks lag and compiled with data received from source agencies, which in turn receive the data from the producing factories/ establishments. These Quick Estimates will undergo revision in subsequent releases as per the revision policy of IIP.
Key Highlights:
Indices
For the month of April 2024, the Quick Estimates of IIP with base 2011-12 stands at 147.7 against 140.7 in April 2023. The Indices of Industrial Production for the Mining, Manufacturing and Electricity sectors for the month of April 2024 stand at 130.8, 144.2 and 212.0 respectively.
As per Use-based classification, the indices stand at 152.2 for Primary Goods, 95.3 for Capital Goods, 156.9 for Intermediate Goods and 183.3 for Infrastructure/ Construction Goods for the month of April 2024. Further, the indices for Consumer durables and Consumer non-durables stand at 118.7 and 151.0 respectively for the month of April 2024.
Growth Rate (Y-o-Y)
The IIP growth rate for the month of April 2024 over the corresponding period of previous year is 5.0 percent. The IIP growth rate in April 2023 was 4.6 percent. The growth rates of the three sectors, Mining, Manufacturing and Electricity for the month of April 2024 over April 2023 are 6.7 percent, 3.9 percent and 10.2 percent respectively. Within the manufacturing sector, the growth rate of the top three positive contributors to the growth of IIP for the month of April 2024 are – “Manufacture of basic metals” (8.1%), “Manufacture of coke and refined petroleum products” (4.9%), and “Manufacture of motor vehicles, trailers and semi-trailers” (11.4%).
The corresponding growth rates of IIP as per Use-based classification in April 2024 over April 2023 are 7.0 percent in Primary goods, 3.1 percent in Capital goods, 3.2 percent in Intermediate goods, 8.0 percent in Infrastructure/ Construction Goods, 9.8 percent in Consumer durables and -2.4 percent in Consumer non-durables (Statement III). Based on use-based classification, top three positive contributors to the growth of IIP for the month of April 2024 are – Primary goods, Infrastructure/Construction goods and Consumer durables.
Monthly Indices and Growth Rate (in %) of IIP for the last 13 months
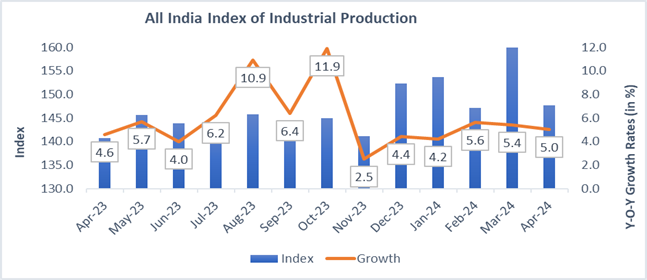
Along with the Quick Estimates of IIP for the month of April 2024, the indices for March 2024 have undergone the first revision and those for January 2024 have undergone final revision in the light of the updated data received from the source agencies. The Quick Estimates for April 2024, the first revision for March 2024 and the final revision for January 2024 have been compiled at weighted response rates of 92 percent, 96 percent and 96 percent respectively.
Details of Quick Estimates of the Index of Industrial Production for the month of April 2024 at Sectoral, 2-digit level of National Industrial Classification (NIC-2008) and by Use-based classification are given at Statements I, II and III respectively. Also, for users to appreciate the changes in the industrial sector, Statement IV provides month-wise indices for the last 12 months, by industry groups (as per 2-digit level of NIC-2008) and sectors.
Release of the Index for May 2024 will be on Friday, 12th July 2024.
Note: –
This Press release (English and Hindi Version) is also available at the Ministry’s Website –http://www.mospi.gov.in.
Detailed information pertaining to IIP is available at https://mospi.gov.in/iip
STATEMENT I: INDEX OF INDUSTRIAL PRODUCTION – SECTORAL
(Base: 2011-12=100)
Month
Mining
Manufacturing
Electricity
General
(14.372472)
(77.63321)
(7.994318)
(100)
2022-23
2023-24
2024-25
2022-23
2023-24
2024-25
2022-23
2023-24
2024-25
2022-23
2023-24
2024-25
Apr*
116.6
122.6
130.8
131.6
138.8
144.2
194.5
192.3
212.0
134.5
140.7
147.7
May
120.4
128.1
134.6
143.1
199.9
201.6
137.8
145.6
Jun
113.7
122.3
136.8
141.6
196.9
205.2
138.3
143.9
Jul
101.1
111.9
135.0
142.1
188.9
204.0
134.4
142.7
Aug
99.6
111.9
131.3
144.4
191.3
220.5
131.5
145.8
Sep
100.0
111.5
134.6
141.5
187.4
205.9
133.8
142.3
Oct
112.6
127.4
128.5
142.1
169.3
203.8
129.5
144.9
Nov
122.7
131.3
137.5
139.3
166.7
176.3
137.7
141.1
Dec
132.6
139.5
144.9
151.6
179.4
181.6
145.9
152.3
Jan
136.1
144.3
145.5
150.8
186.6
197.1
147.4
153.6
Feb
129.2
139.7
137.6
144.3
174.0
187.1
139.3
147.1
Mar
154.2
156.2
147.5
156.0
188.0
204.2
151.7
159.9
Average
Apr-Mar
119.9
128.9
–
137.1
144.6
–
185.2
198.3
–
138.5
146.7
–
Growth over the corresponding period of previous year#
Apr*
8.4
5.1
6.7
5.6
5.5
3.9
11.8
-1.1
10.2
6.7
4.6
5.0
Apr-Mar
5.8
7.5
–
4.7
5.5
–
8.9
7.1
–
5.2
5.9
–
* Figures for Apr’24 are Quick Estimates.
NOTE: Indices for the months of Jan’24 and Mar’24 incorporate updated production data.
#The growth rates over corresponding period of previous year are to be interpreted considering the unusual circumstances on account of COVID 19 pandemic since March 2020
STATEMENT II: INDEX OF INDUSTRIAL PRODUCTION – (2-DIGIT LEVEL)
(Base: 2011-12=100)
Industry
Description
Weight
Index
Cumulative Index
Percentage growth#
code
Apr’23
Apr’24*
Apr-Mar*
Apr’24*
Apr-Mar*
2022-23
2023-24
2023-24
10
Manufacture of food products
5.3025
137.8
120.3
132.4
134.4
-12.7
1.5
11
Manufacture of beverages
1.0354
109.2
122.0
105.5
110.9
11.7
5.1
12
Manufacture of tobacco products
0.7985
67.1
61.1
88.4
81.1
-8.9
-8.3
13
Manufacture of textiles
3.2913
105.6
105.9
107.5
107.7
0.3
0.2
14
Manufacture of wearing apparel
1.3225
92.1
103.7
127.9
109.9
12.6
-14.1
15
Manufacture of leather and related products
0.5021
97.7
89.3
96.0
95.0
-8.6
-1.0
16
Manufacture of wood and products of wood and cork, except furniture; manufacture of articles of straw and plaiting materials
0.1930
89.4
84.5
104.5
98.3
-5.5
-5.9
17
Manufacture of paper and paper products
0.8724
79.8
76.6
82.4
79.4
-4.0
-3.6
18
Printing and reproduction of recorded media
0.6798
88.6
83.8
90.6
89.4
-5.4
-1.3
19
Manufacture of coke and refined petroleum products
11.7749
129.1
135.4
128.0
133.0
4.9
3.9
20
Manufacture of chemicals and chemical products
7.8730
126.6
126.6
129.3
127.2
0.0
-1.6
21
Manufacture of pharmaceuticals, medicinal chemical and botanical products
4.9810
237.0
244.3
216.2
233.6
3.1
8.0
22
Manufacture of rubber and plastics products
2.4222
106.3
109.7
104.5
109.2
3.2
4.5
23
Manufacture of other non-metallic mineral products
4.0853
146.7
149.2
135.3
144.2
1.7
6.6
24
Manufacture of basic metals
12.8043
201.9
218.2
191.9
214.1
8.1
11.6
25
Manufacture of fabricated metal products, except machinery and equipment
2.6549
76.4
84.2
85.3
92.4
10.2
8.3
26
Manufacture of computer, electronic and optical products
1.5704
111.5
115.8
137.2
121.7
3.9
-11.3
27
Manufacture of electrical equipment
2.9983
106.6
110.1
99.3
106.7
3.3
7.5
28
Manufacture of machinery and equipment n.e.c.
4.7653
107.7
108.8
113.5
120.8
1.0
6.4
29
Manufacture of motor vehicles, trailers and semi-trailers
4.8573
112.9
125.8
114.5
127.8
11.4
11.6
30
Manufacture of other transport equipment
1.7763
119.5
140.3
127.0
144.7
17.4
13.9
31
Manufacture of furniture
0.1311
144.7
200.2
204.1
190.1
38.4
-6.9
32
Other manufacturing
0.9415
87.8
97.2
90.9
85.3
10.7
-6.2
05
Mining
14.3725
122.6
130.8
119.9
128.9
6.7
7.5
10-32
Manufacturing
77.6332
138.8
144.2
137.1
144.6
3.9
5.5
35
Electricity
7.9943
192.3
212.0
185.2
198.3
10.2
7.1
General Index
100.00
140.7
147.7
138.5
146.7
5.0
5.9
* Figures for Apr 2024 are Quick Estimates.
#The growth rates over corresponding period of previous year are to be interpreted considering the unusual circumstances on account of COVID 19 pandemic since March 2020
STATEMENT III: INDEX OF INDUSTRIAL PRODUCTION – USE-BASED
(Base :2011-12=100)
Primary goods
Capital goods
Intermediate goods
Infrastructure/ Construction goods
Consumer durables
Consumer non-durables
Month
(34.048612)
(8.223043)
(17.221487)
(12.338363)
(12.839296)
(15.329199)
2022-23
2023-24
2024-25
2022-23
2023-24
2024-25
2022-23
2023-24
2024-25
2022-23
2023-24
2024-25
2022-23
2023-24
2024-25
2022-23
2023-24
2024-25
Apr*
139.5
142.2
152.2
88.5
92.4
95.3
149.5
152.0
156.9
149.7
169.8
183.3
110.7
108.1
118.7
138.9
154.7
151.0
May
144.7
149.9
94.9
102.6
151.7
156.9
153.3
173.2
113.9
115.6
137.5
149.8
Jun
139.3
146.7
104.4
107.4
146.6
154.2
150.8
170.9
125.3
116.8
145.9
146.7
Jul
131.7
141.8
97.1
102.1
149.0
153.8
151.3
170.3
121.4
117.0
141.7
153.5
Aug
129.4
145.4
95.0
107.4
146.6
157.4
152.8
176.8
116.2
123.2
134.9
148.3
Sep
128.5
138.8
103.9
112.6
145.3
154.2
156.9
172.8
123.8
125.0
138.9
142.6
Oct
131.2
146.1
87.2
106.1
143.8
157.5
156.2
175.9
106.1
123.0
130.3
142.4
Nov
132.6
143.8
99.1
98.0
146.3
151.3
161.7
164.2
111.9
106.5
162.7
157.2
Dec
145.0
151.9
100.1
103.8
154.1
159.8
170.9
180.3
108.8
114.5
174.4
179.7
Jan
149.9
154.3
104.9
108.3
155.6
163.8
176.9
186.6
108.8
121.4
164.4
164.9
Feb
139.9
148.2
104.9
106.0
145.1
157.7
165.7
179.8
108.3
121.7
154.8
149.4
Mar
158.3
163.1
123.0
131.1
159.4
168.2
181.7
195.2
118.6
129.9
147.5
155.3
Average
Apr-Mar
139.2
147.7
–
100.3
106.5
–
149.4
157.2
–
160.7
176.3
–
114.5
118.6
–
147.7
153.7
–
Growth over the corresponding period of previous year#
Apr*
10.3
1.9
7.0
12.0
4.4
3.1
7.1
1.7
3.2
4.0
13.4
8.0
7.2
-2.3
9.8
-0.8
11.4
-2.4
Apr-Mar
7.5
6.1
–
13.1
6.2
–
3.8
5.2
–
8.4
9.7
–
0.6
3.6
–
0.7
4.1
–
* Figures for Apr 2024 are Quick Estimates.
NOTE : Indices for the months of Jan’24 and Mar’24 incorporate updated production data.
#The Indices are to be interpreted considering the unusual circumstances on account of COVID 19 pandemic since March 2020
STATEMENT IV: MONTHLY INDEX OF INDUSTRIAL PRODUCTION – (2-DIGIT LEVEL)
(Base: 2011-12=100)
Industry code
Description
Weight
May-23
Jun-23
Jul-23
Aug-23
Sep-23
Oct-23
Nov-23
Dec-23
Jan-24
Feb-24
Mar-24
Apr-24
10
Manufacture of food products
5.3025
123.2
113.6
121.6
123.9
114.6
123.5
141.5
160.8
158.9
151.0
142.5
120.3
11
Manufacture of beverages
1.0354
124.1
125.0
109.4
103.4
101.6
99.6
100.7
101.3
112.6
120.0
124.3
122.0
12
Manufacture of tobacco products
0.7985
83.7
93.8
71.8
81.4
89.8
82.7
79.8
82.7
84.6
77.5
78.4
61.1
13
Manufacture of textiles
3.2913
107.4
107.8
108.5
107.1
108.4
110.2
102.7
112.3
109.7
105.7
106.5
105.9
14
Manufacture of wearing apparel
1.3225
112.2
120.1
103.9
97.8
102.4
97.8
92.9
113.1
117.3
125.4
143.2
103.7
15
Manufacture of leather and related products
0.5021
101.1
103.4
95.1
92.4
91.8
91.1
78.8
95.9
99.9
96.5
95.9
89.3
16
Manufacture of wood and products of wood and cork, except furniture; manufacture of articles of straw and plaiting materials
0.1930
98.7
98.0
98.4
98.5
108.1
93.7
87.6
97.7
96.4
101.8
111.5
84.5
17
Manufacture of paper and paper products
0.8724
77.9
81.3
82.1
82.3
78.5
78.5
73.3
78.1
79.1
78.6
83.2
76.6
18
Printing and reproduction of recorded media
0.6798
88.7
88.7
89.0
91.0
87.5
87.0
84.1
95.5
91.3
89.4
92.3
83.8
19
Manufacture of coke and refined petroleum products
11.7749
138.0
133.5
131.9
131.7
122.4
125.7
132.9
141.9
134.7
131.2
142.4
135.4
20
Manufacture of chemicals and chemical products
7.8730
133.8
130.5
128.6
126.8
123.6
126.5
119.5
127.5
127.6
124.8
130.3
126.6
21
Manufacture of pharmaceuticals, medicinal chemical and botanical products
4.9810
227.9
225.3
244.5
225.9
220.1
212.8
244.3
286.3
245.6
205.0
228.1
244.3
22
Manufacture of rubber and plastics products
2.4222
112.7
106.5
107.7
108.5
106.5
109.0
105.1
106.9
112.8
111.2
116.8
109.7
23
Manufacture of other non-metallic mineral products
4.0853
148.4
149.5
134.0
142.5
132.8
140.5
127.0
147.1
147.5
148.9
165.4
149.2
24
Manufacture of basic metals
12.8043
206.3
203.4
209.4
217.4
213.6
217.2
207.3
220.2
226.9
213.2
232.1
218.2
25
Manufacture of fabricated metal products, except machinery and equipment
2.6549
87.1
86.7
83.8
100.0
97.1
92.8
81.0
98.1
95.1
95.7
114.8
84.2
26
Manufacture of computer, electronic and optical products
1.5704
115.1
121.9
118.6
131.4
149.4
123.1
96.7
111.6
120.8
126.1
134.7
115.8
27
Manufacture of electrical equipment
2.9983
106.6
103.5
102.5
108.6
108.0
94.8
89.0
116.6
108.1
111.6
124.3
110.1
28
Manufacture of machinery and equipment n.e.c.
4.7653
116.2
123.7
119.9
126.3
127.0
123.3
109.1
115.5
116.4
119.8
145.1
108.8
29
Manufacture of motor vehicles, trailers and semi-trailers
4.8573
126.1
123.6
129.5
128.6
130.5
135.7
126.7
118.5
140.5
130.3
130.3
125.8
30
Manufacture of other transport equipment
1.7763
131.2
140.6
123.5
145.9
166.0
157.2
144.5
137.2
149.5
145.8
175.7
140.3
31
Manufacture of furniture
0.1311
179.9
183.0
190.6
189.5
185.1
176.8
144.5
197.4
199.0
212.6
278.6
200.2
32
Other manufacturing
0.9415
79.2
85.6
97.1
94.6
96.7
103.7
65.8
70.5
76.6
76.3
90.0
97.2
5
Mining
14.3725
128.1
122.3
111.9
111.9
111.5
127.4
131.3
139.5
144.3
139.7
156.2
130.8
10-32
Manufacturing
77.6332
143.1
141.6
142.1
144.4
141.5
142.1
139.3
151.6
150.8
144.3
156.0
144.2
35
Electricity
7.9943
201.6
205.2
204.0
220.5
205.9
203.8
176.3
181.6
197.1
187.1
204.2
212.0
General Index
100
145.6
143.9
142.7
145.8
142.3
144.9
141.1
152.3
153.6
147.1
159.9
147.7
* Figures for Apr’24 are Quick Estimates.
NOTE: Indices for the months of Jan’24 and Mar’24 incorporate updated production data.