Periodic Labour Force Survey (PLFS) – Quarterly Bulletin (January-March 2024)
Periodic Labour Force Survey (PLFS) – Quarterly Bulletin (January-March 2024)
Key Findings
Considering the importance of availability of labour force data at more frequent time intervals, National Sample Survey Office (NSSO) launched Periodic Labour Force Survey (PLFS) in April 2017.
The objective of PLFS is primarily twofold:
Twenty-one Quarterly Bulletins of PLFS corresponding to the quarter ending December 2018 to quarter ending December 2023 have already been released. In these quarterly bulletins estimates of labour force indicators, viz., Labour Force Participation Rate (LFPR), Worker Population Ratio (WPR), Unemployment Rate (UR), distribution of workers by broad status in employment and industry of work in the Current Weekly Status (CWS) for urban areas have been presented.
The present Quarterly Bulletin is the twenty-second in the series for the quarter January – March, 2024.
PLFS fieldwork during the quarter January – March 2024
The fieldwork for collection of information in respect of all the samples allotted for theperiod January – March, 2024, was completed timely for the first visit as well as revisit samples, except for 10 first visit FSU[1]s; three each in the State of Manipur and Madhya Pradesh; and one each from Punjab, Gujarat, Maharashtra and Andhra Pradesh and 38 revisit FSUs (28 from State of Manipur, two each from states of Maharashtra, Telangana & Tamil Nadu and one each from States of Meghalaya, Chhattisgarh, Madhya Pradesh & Andhra Pradesh), which were treated as casualty.
These aspects may be kept in mind while using the estimates of PLFS for the concerned quarter.
A rotational panel sampling design has been used in urban areas. In this rotational panel scheme, each selected household in urban areas is visited four times, in the beginning with ‘First Visit Schedule’ and thrice periodically later with a ‘Revisit Schedule’. The scheme of rotation ensures that 75% of the first-stage sampling units (FSUs) are matched between two consecutive visits.
At the all-India level, in the urban areas, a total number of 5,706 FSUs (urban sampling unit curved out from Urban Frame Survey) have been surveyed during the quarter January – March 2024. The number of urban households surveyed was 44,598 and number of persons surveyed was 1,69,459 in urban areas.
Conceptual Framework of Key Employment and Unemployment Indicators for the Quarterly Bulletin: The Periodic Labour Force Survey (PLFS) gives estimates of key employment and unemployment Indicators like the Labour Force Participation Rate (LFPR), Worker Population Ratio (WPR), Unemployment Rate (UR), etc. These indicators, and ‘Current Weekly Status’ are defined as follows:
The Quarterly Bulletin for the quarter January – March 2024 is available at the website of the Ministry (https://mospi.gov.in). The key results are given in the statements annexed.
Annexure
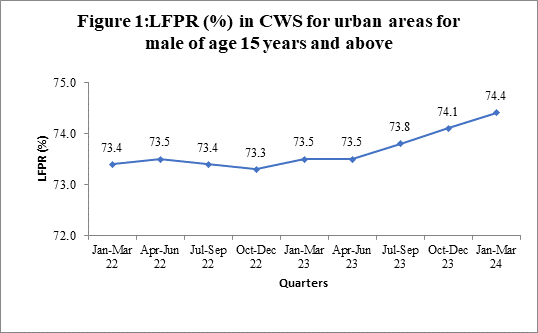
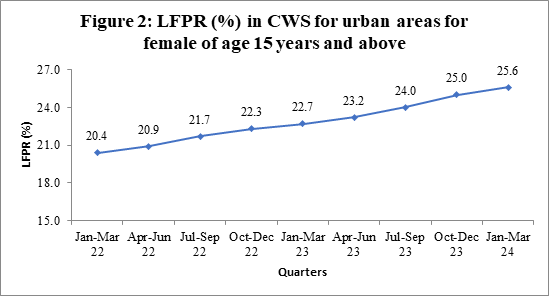
LFPR in urban areas increased from 48.5% in January – March 2023 to 50.2% in January – March 2024 for persons of age 15 years in above. While for male LFPR increased from 73.5% to 74.4% during this period, for female, LFPR increased from 22.7% to 25.6% during this period.
Statement 1: LFPR (in per cent) in CWS in urban areas for persons of age 15 years and above
all‑India
survey period
Male
Female
Person
(1)
(2)
(3)
(4)
January – March 2023
73.5
22.7
48.5
April – June 2023
73.5
23.2
48.8
July – September 2023
73.8
24.0
49.3
October – December 2023
74.1
25.0
49.9
January – March 2024
74.4
25.6
50.2
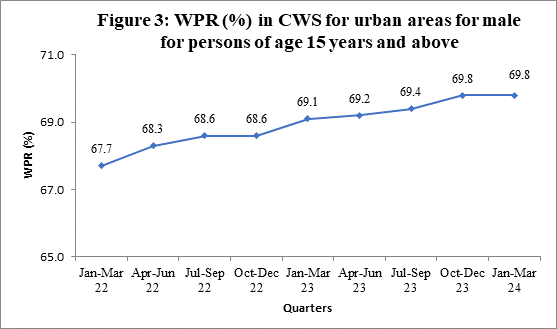
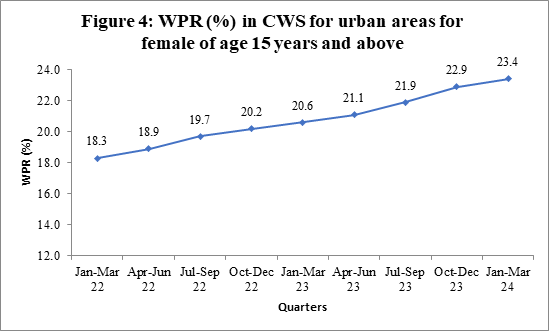
WPR in urban areas increased from 45.2% in January – March 2023 to 46.9% in January – March 2024 for persons of age 15 years in above. For male, it increased from 69.1% to 69.8% during this period and for female, it increased from 20.6% to 23.4% during this period.
Statement 2: WPR (in per cent) in CWS in urban areas for persons of age 15 years and above
all‑India
survey period
Male
Female
Person
(1)
(2)
(3)
(4)
January – March 2023
69.1
20.6
45.2
April – June 2023
69.2
21.1
45.5
July – September 2023
69.4
21.9
46.0
October – December 2023
69.8
22.9
46.6
January – March 2024
69.8
23.4
46.9
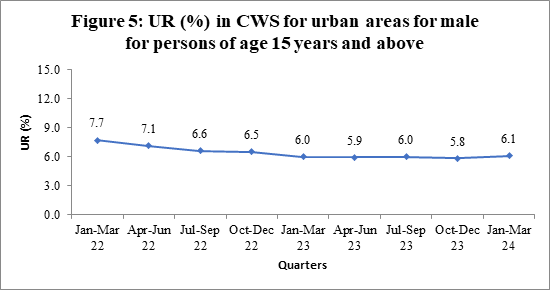
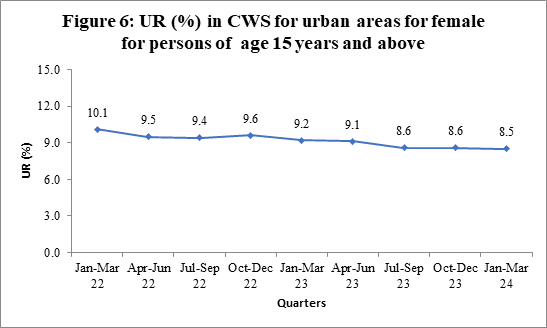
Unemployment Rate in urban areas decreased from 6.8% in January – March 2023 to 6.7% in January – March2024 for persons of age 15 years in above. For male, UR increased from 6.0% in January – March 2023 to 6.1% in January – March2024, while for female UR decreased from 9.2% in January – March 2023 to 8.5% in January – March2024.
Statement 3: UR (in per cent) in CWS in urban areas for persons of age 15 years and above
all‑India
survey period
Male
Female
Person
(1)
(2)
(3)
(4)
January – March 2023
6.0
9.2
6.8
April – June 2023
5.9
9.1
6.6
July – September 2023
6.0
8.6
6.6
October – December 2023
5.8
8.6
6.5
January – March 2024
6.1
8.5
6.7
The trend in LFPR in urban areas since the quarter January – March, 2022 for male and female are presented in figure 1 and 2.
The trend in WPR in urban areas since the quarter January – March, 2022 for male and female are presented in figure 3 and 4.
The trend in UR in urban areas since the quarter January – March, 2022 for male and female are presented in figure 5 and 6.