₹1,68,337 crore gross GST revenue collected during February 2024; records Year-on-Year (Y-o-Y) growth of 12.5%
₹1,68,337 crore gross GST revenue collected during February 2024; records Year-on-Year (Y-o-Y) growth of 12.5%
Gross Goods and Services Tax (GST) revenue collected for February 2024 is ₹1,68,337 crore, marking a robust 12.5% increase compared to that in the same month in 2023. This growth was driven by a 13.9% rise in GST from domestic transactions and 8.5% increase in GST from import of goods. GST revenue net of refunds for February 2024 is ₹1.51 lakh crore which is a growth of 13.6% over that for the same period last year.
Strong Consistent Performance in FY 2023-24: As of February 2024, the total gross GST collection for the current fiscal year stands at ₹18.40 lakh crore, which is 11.7% higher than the collection for the same period in FY 2022-23. The average monthly gross collection for FY 2023-24 is ₹1.67 lakh crore, exceeding the ₹1.5 lakh crore collected in the previous year’s corresponding period. GST revenue net of refunds as of February 2024 for the current fiscal year is ₹16.36 lakh crore which is a growth of 13.0% over that for the same period last year. Overall, the GST revenue figures demonstrate continued growth momentum and positive performance.
Breakdown of February 2024 Collections:
Inter-Governmental Settlement: The central government settled ₹41,856 crore to CGST and ₹35,953 crore to SGST from the IGST collected. This translates to a total revenue of ₹73,641 crore for CGST and ₹75,569 crore for SGST after regular settlement.
The chart below shows trends in monthly gross GST revenues during the current year. Table-1 shows the state-wise figures of GST collected in each State during the month of February, 2024 as compared to February, 2023. Table-2 shows the state-wise figures of post settlement GST revenue of each State till the month of February, 2024.
Chart: Trends in GST Collection
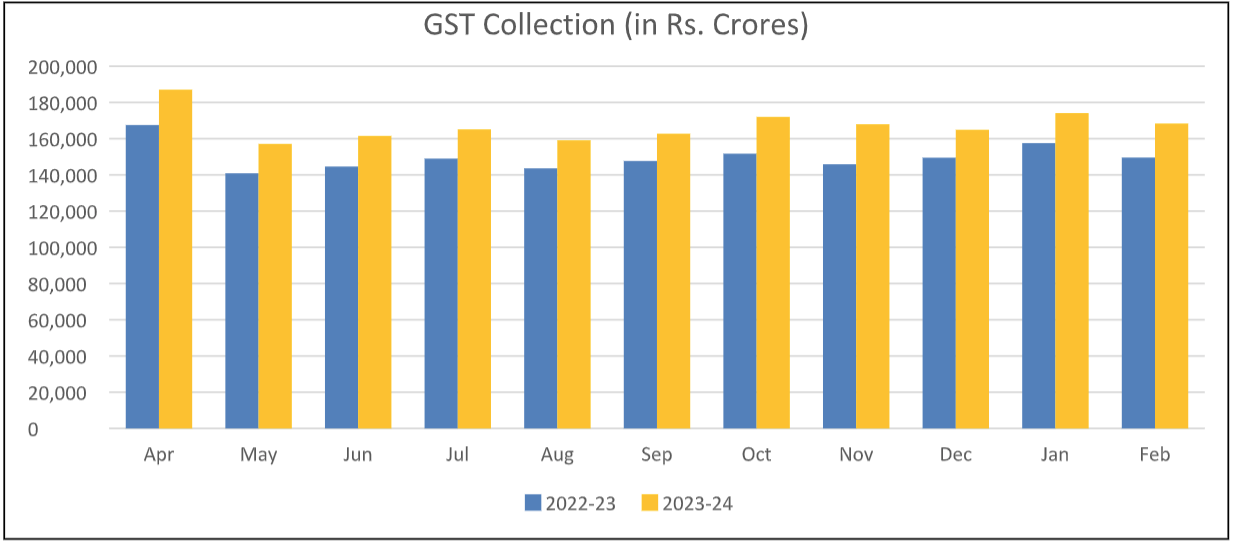
Table 1: State-wise growth of GST Revenues during February, 2024[1]
State/UT
Feb-23
Feb-24
Growth (%)
Jammu and Kashmir
434
532
23%
Himachal Pradesh
691
746
8%
Punjab
1,651
1,955
18%
Chandigarh
188
211
12%
Uttarakhand
1,405
1,525
9%
Haryana
7,310
8,269
13%
Delhi
4,769
5,544
16%
Rajasthan
3,941
4,211
7%
Uttar Pradesh
7,431
8,054
8%
Bihar
1,499
1,491
-1%
Sikkim
265
299
13%
Arunachal Pradesh
78
101
29%
Nagaland
54
51
-5%
Manipur
64
56
-13%
Mizoram
58
49
-14%
Tripura
79
85
8%
Meghalaya
189
193
2%
Assam
1,111
1,390
25%
West Bengal
4,955
5,357
8%
Jharkhand
2,962
2,933
-1%
Odisha
4,519
5,136
14%
Chhattisgarh
3,009
3,124
4%
Madhya Pradesh
3,235
3,572
10%
Gujarat
9,574
11,029
15%
Dadra and Nagar Haveli and Daman & Diu
283
355
25%
Maharashtra
22,349
27,065
21%
Karnataka
10,809
12,815
19%
Goa
493
581
18%
Lakshadweep
3
2
-36%
Kerala
2,326
2,688
16%
Tamil Nadu
8,774
9,713
11%
Puducherry
188
231
23%
Andaman and Nicobar Islands
31
39
28%
Telangana
4,424
5,211
18%
Andhra Pradesh
3,557
3,678
3%
Ladakh
24
35
43%
Other Territory
211
204
-3%
Center Jurisdiction
154
232
51%
Grand Total
1,13,096
1,28,760
14%
Table-2: SGST & SGST portion of IGST settled to States/UTs
April-February (Rs. in crore)
Pre-Settlement SGST
Post-Settlement SGST[2]
State/UT
2022-23
2023-24
Growth
2022-23
2023-24
Growth
Jammu and Kashmir
2,133
2,680
26%
6,672
7,415
11%
Himachal Pradesh
2,150
2,371
10%
5,133
5,138
0%
Punjab
7,023
7,689
9%
17,810
20,240
14%
Chandigarh
577
626
9%
1,963
2,117
8%
Uttarakhand
4,365
4,934
13%
6,997
7,708
10%
Haryana
16,547
18,568
12%
28,469
31,975
12%
Delhi
12,504
14,235
14%
26,097
29,187
12%
Rajasthan
14,227
15,762
11%
32,008
35,505
11%
Uttar Pradesh
24,900
29,560
19%
60,572
69,782
15%
Bihar
6,678
7,478
12%
21,319
24,231
14%
Sikkim
274
387
42%
773
877
13%
Arunachal Pradesh
422
548
30%
1,451
1,721
19%
Nagaland
203
270
33%
884
955
8%
Manipur
288
310
8%
1,318
1,011
-23%
Mizoram
189
245
29%
798
879
10%
Tripura
390
455
17%
1,348
1,435
6%
Meghalaya
435
550
26%
1,370
1,557
14%
Assam
4,694
5,413
15%
11,524
13,347
16%
West Bengal
19,626
21,407
9%
35,884
38,335
7%
Jharkhand
7,034
7,967
13%
10,359
11,220
8%
Odisha
12,779
14,796
16%
17,636
22,636
28%
Chhattisgarh
6,765
7,417
10%
10,320
12,450
21%
Madhya Pradesh
9,893
11,865
20%
25,483
30,386
19%
Gujarat
34,364
38,465
12%
52,751
58,317
11%
Dadra and Nagar Haveli and Daman and Diu
581
599
3%
1,093
1,006
-8%
Maharashtra
77,909
91,584
18%
1,18,392
1,34,593
14%
Karnataka
32,302
37,305
15%
60,218
68,428
14%
Goa
1,830
2,137
17%
3,270
3,752
15%
Lakshadweep
9
18
107%
37
79
114%
Kerala
11,247
12,809
14%
26,851
28,358
6%
Tamil Nadu
32,929
37,024
12%
53,091
58,904
11%
Puducherry
426
467
10%
1,069
1,255
17%
Andaman and Nicobar Islands
165
191
16%
445
487
9%
Telangana
15,294
18,175
19%
34,686
36,949
7%
Andhra Pradesh
11,462
12,695
11%
26,121
28,873
11%
Ladakh
160
230
44%
494
620
25%
Other Territory
165
218
32%
542
1,043
93%
Grand Total
3,72,937
4,27,449
15%
7,05,246
7,92,773
12%